Welcome
This project is now closed. This online meeting was open to the public from Wednesday, July 29, 2020 through Friday, October 23, 2020. Thank you for your interest and participation in our online engagement.
How to navigate
- Click the arrows on the right of your screen to go forward or the left to go backward. Use the navigation bar on the top of your screen to revisit any part of the meeting.
How to participate
- Click the arrows on the right of your screen to go forward or the left to go backward. Use the navigation bar on the left side of your screen to revisit any part of the meeting.
- Provide a comment at any point by clicking the “Comment” button at the top right of your screen. You may close the form to continue through the slides. Once finished, please make sure to hit "Submit" to confirm that your comment is sent to the project team.
Following guidance from state health officials to prevent the further spread of COVID-19, the Minnesota Department of Transportation has temporarily postponed all public meetings and in-person events. Public engagement remains a priority and we appreciate you joining us online to learn more about this project.
About this study
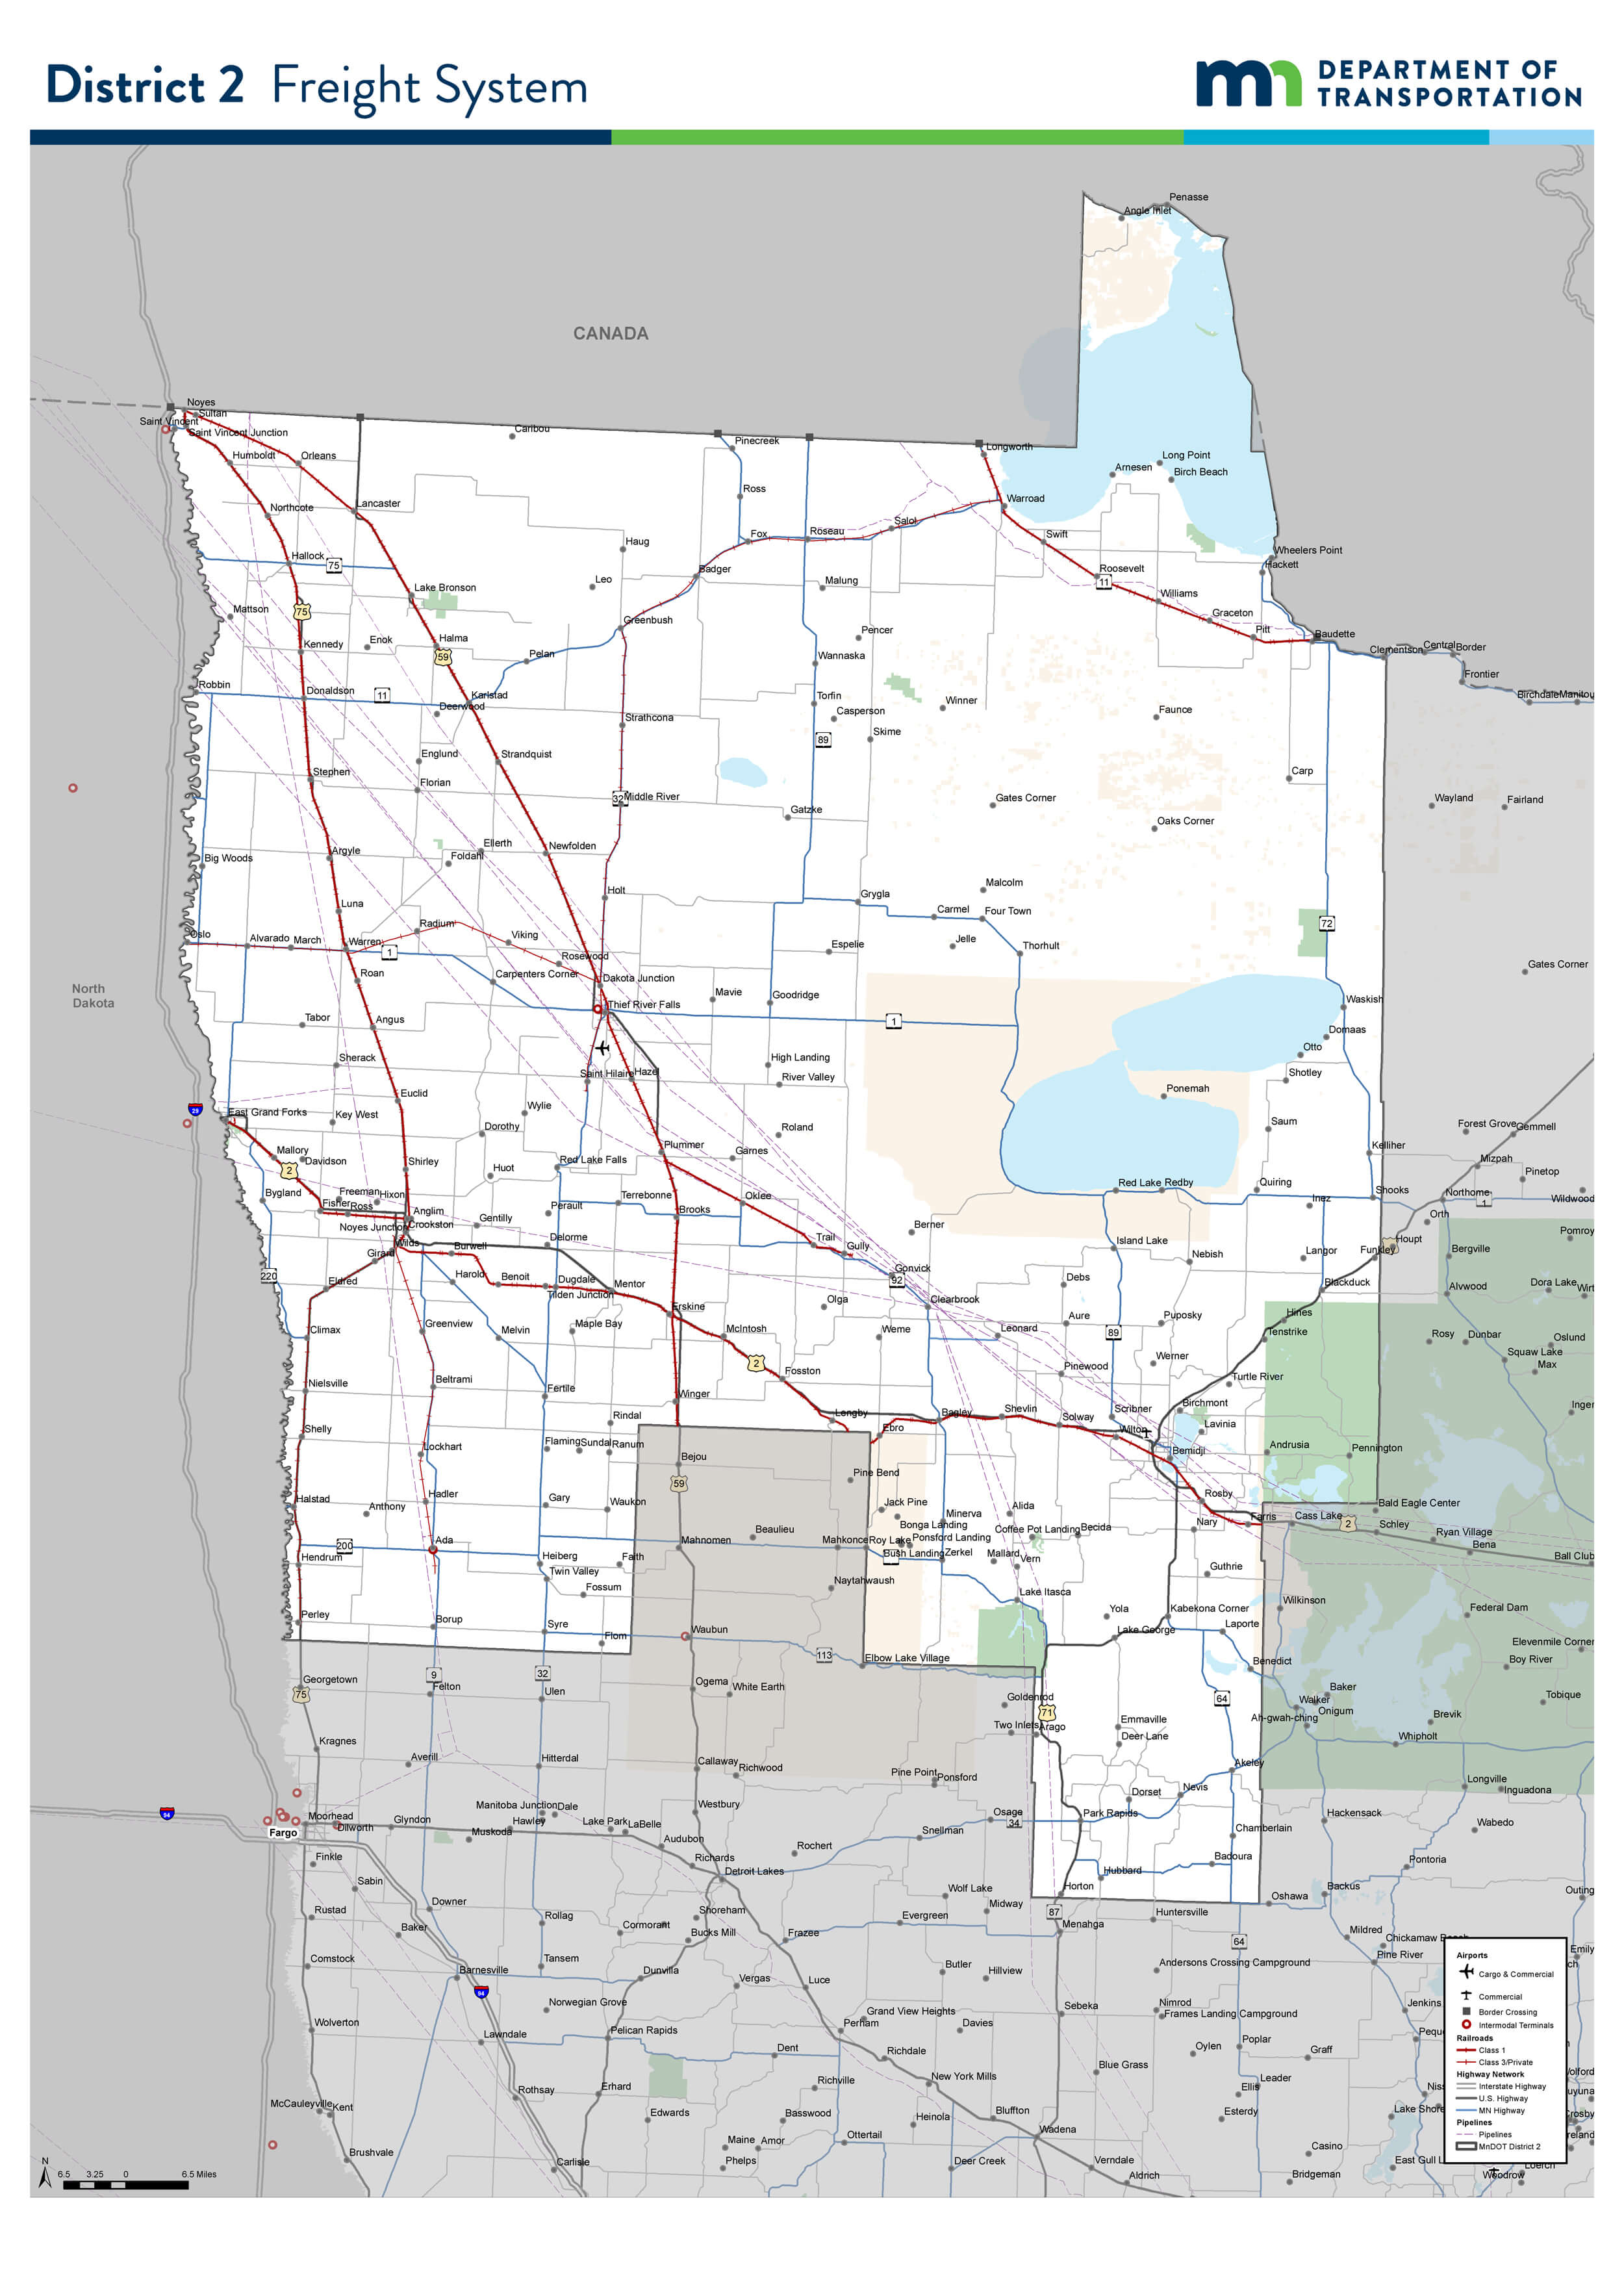
This study is looking at the freight transportation system in Northwest Minnesota to better understand the trends, issues and needs of the area.
Click the image above to enlarge.
Tell Us About Yourself
How do you use this area of the state?
Let’s start by getting to know you a little better! Please take a minute to answer the following survey questions to help us understand how you use this area of the state.
When completing each of the survey included here, please hit the green "Submit" button before continuing on through the slides. This ensures that your answers will be recorded. Thank you for your input!
See the study area
Click the image above to enlarge.
Your feedback — Survey questions
This survey is now closed. Visit the "Stay Connected" slide to learn more.
MnDOT District 2 Overview
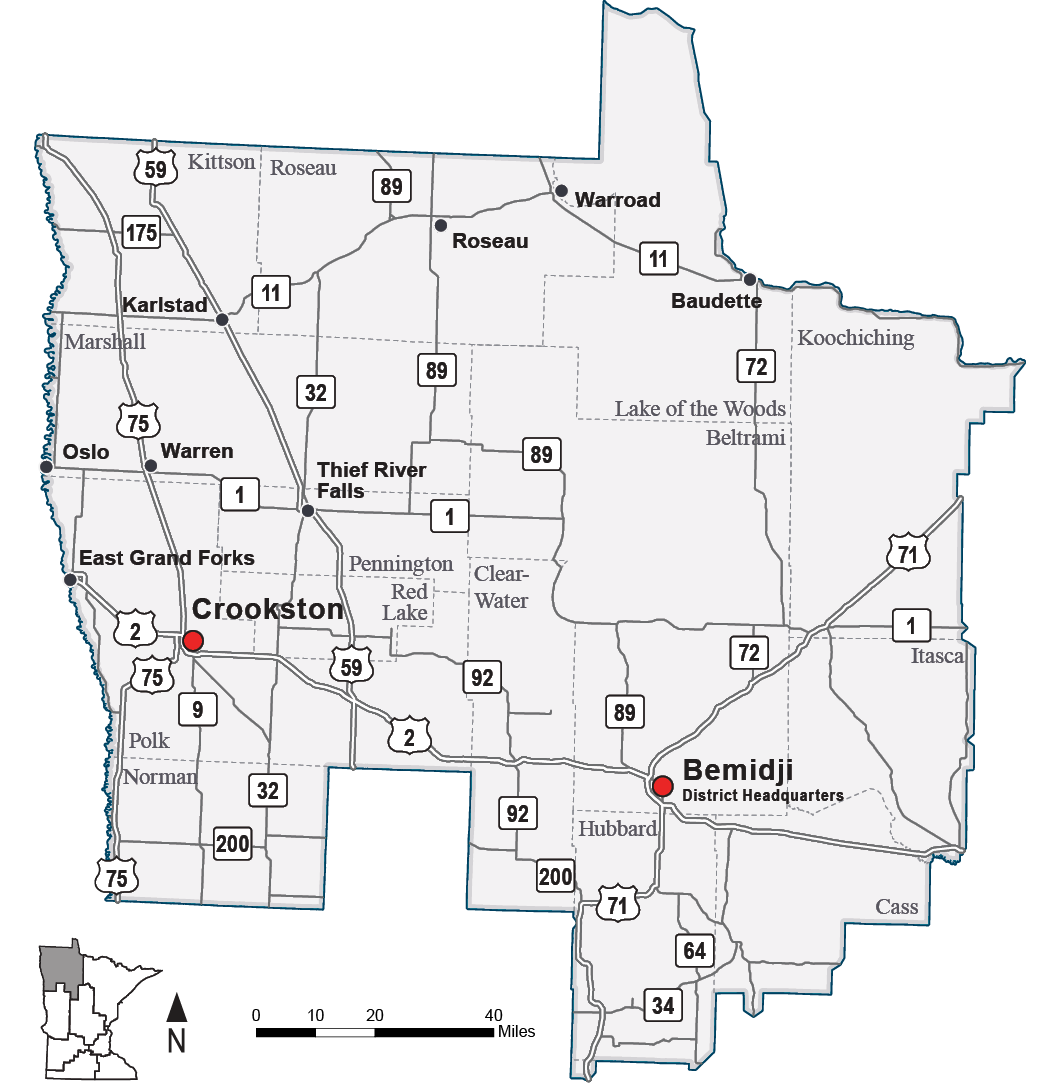
Learn more about MnDOT District 2
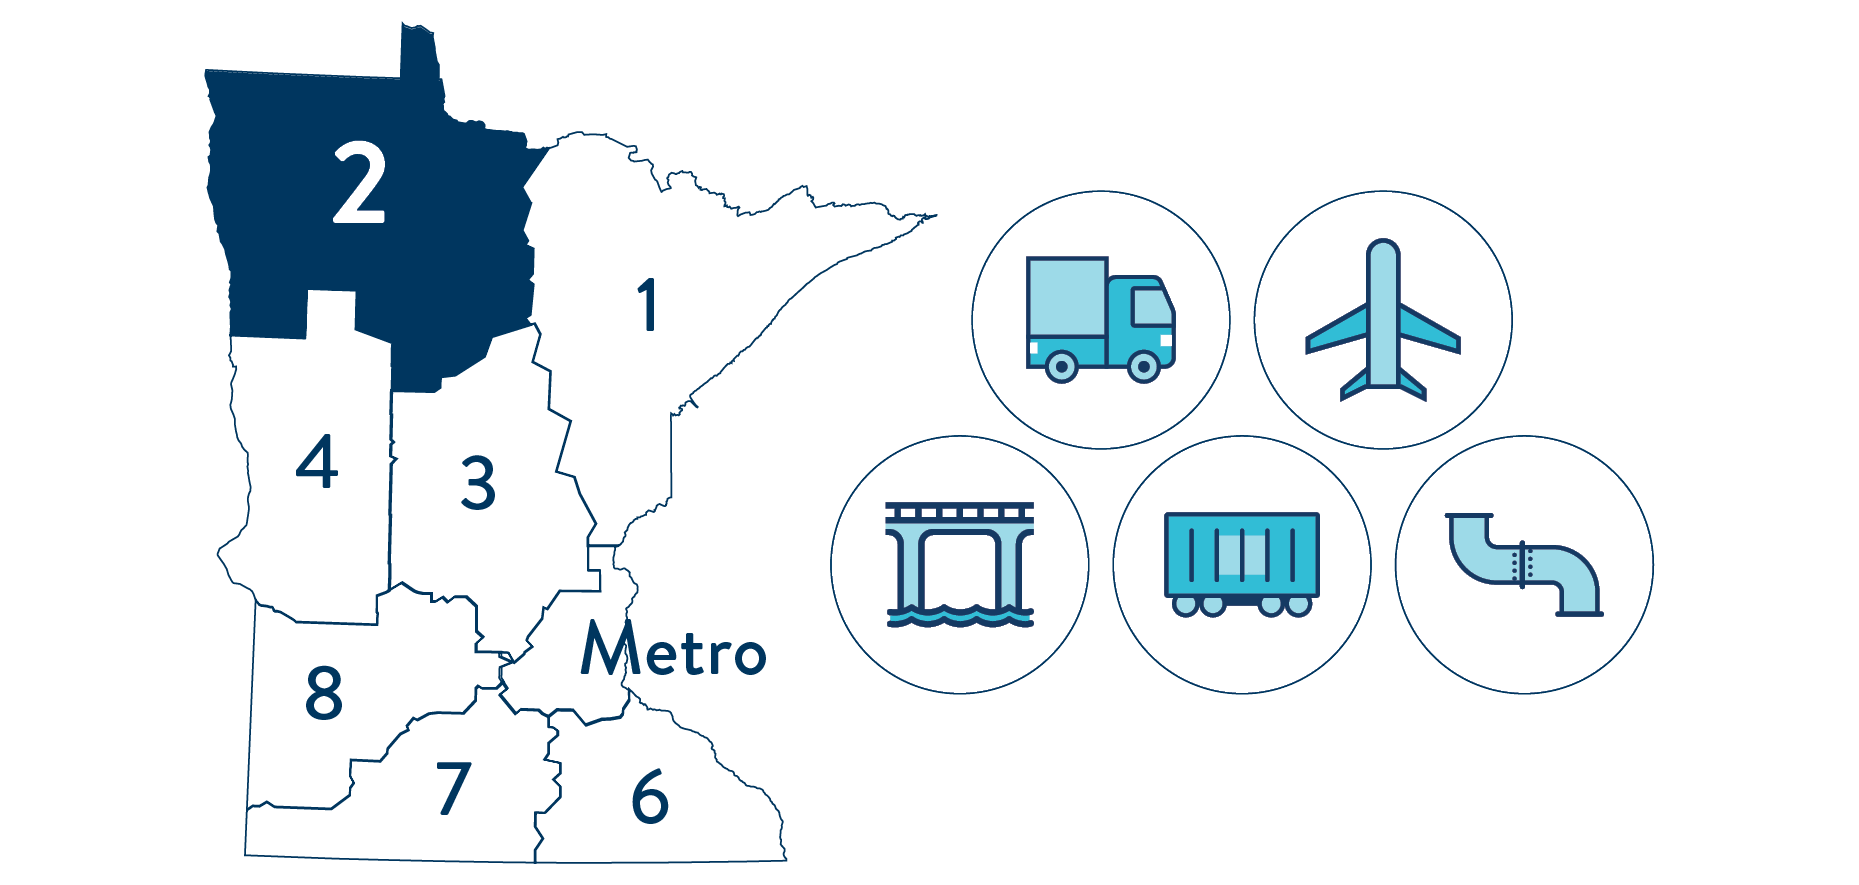
MnDOT is divided operationally into eight regional districts. Each district plans, designs, constructs and maintains the state and federal highways within their areas. Additionally, the districts manage the aid and assistance provided to local governments that qualify for state and federal transportation funding for roadways, bridges, trails and transit systems.
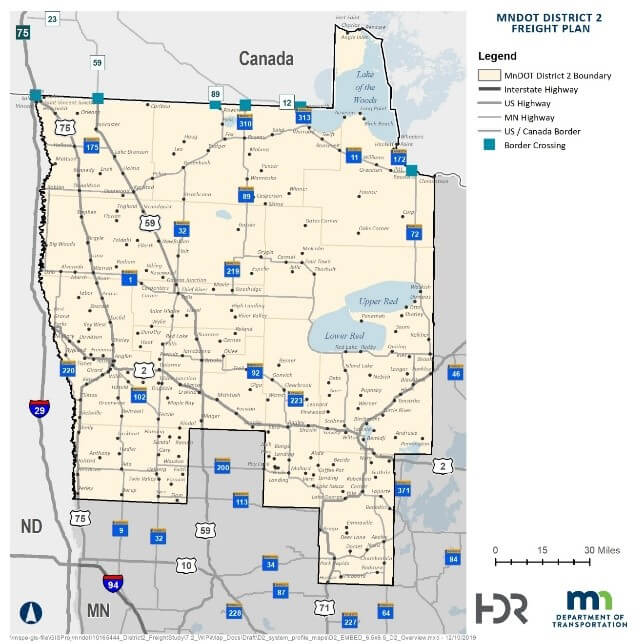
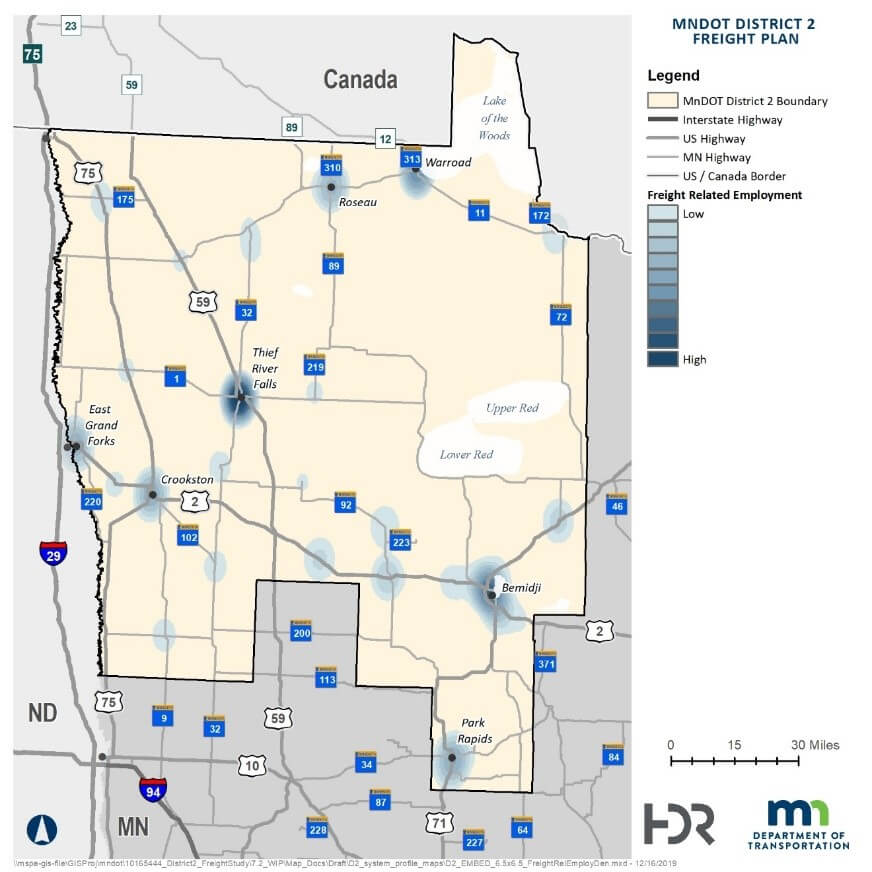
District 2 is located in Northern and Northwest Minnesota and consists of the following counties: Kittson, Roseau, Lake of the Woods, Marshall, Beltrami, Polk, Pennington, Red Lake, Clearwater, Norman, Hubbard, parts of Cass, Itasca, Mahnomen (maintenance only) and Koochiching.
Facts about District 2:
- No interstate highways
- 185 roadway miles in tribal areas
- 35 percent of the region’s highway have substandard shoulders
- 5 US/Canada border crossings
- Non-National Highway System routes make up 62 percent of the region’s responsibility
Click the image above to enlarge.
Study Overview
The Minnesota Department of Transportation is currently in the process of creating a Freight Plan for Northwest Minnesota that will identify opportunities to improve freight infrastructure for all modes that use the system in this area. These future investments will increase the economic competiveness of the region. The Plan will prioritize freight-related projects and develop initial designs and cost estimates for high priority projects.
Study recommendations
The District 2 Freight Plan recommendations will:
Provide an understanding of the
current multimodal freight system
Expand on existing studies and plans using
current data and analysis to identify area freight priorities
Help MnDOT understand how local industries
use the system and their needs and issues
Identify opportunities for public and private
stakeholders to give their input
Guide MnDOT District investments to improve the multimodal freight system
including roadways, railroads, regional airports and pipelines
Integrated freight planning
The Plan also needs to integrate and align with statewide freight planning efforts. Take a look at the flow chart below to see how recommendations from this plan could advance to become part of the Minnesota Highway Freight Program.
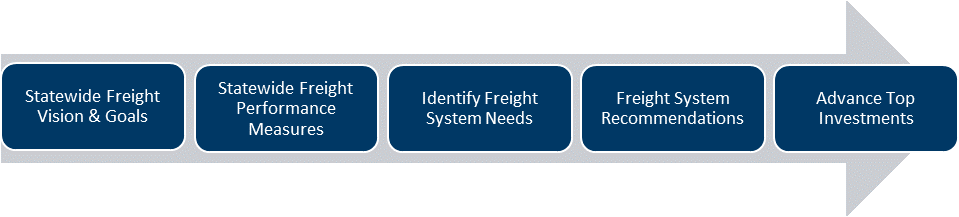
Click the image above to enlarge.
Engagement Summary
Our team has been out engaging with the communities and stakeholders in Northwestern Minnesota to gather input that that helped our team develop the Plan. Information about out our engagement efforts is shown below.
Project advisory committee
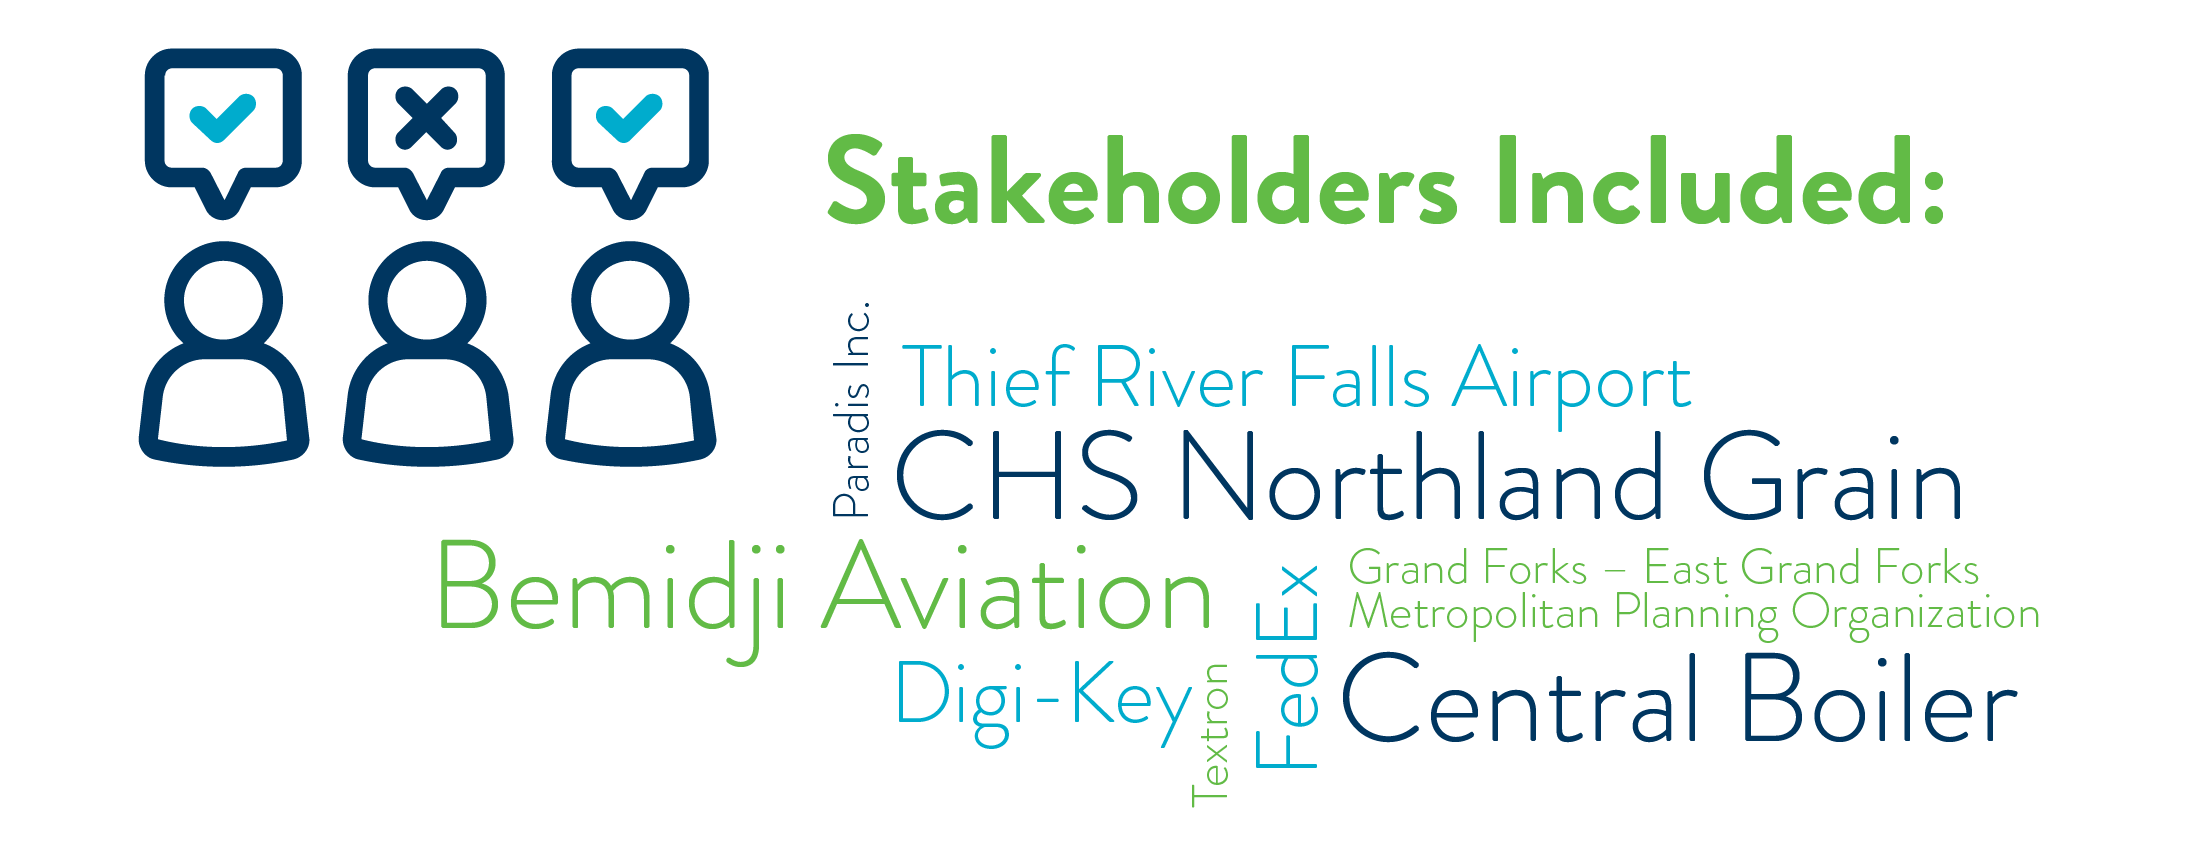
We have a committee of freight and public stakeholders serving as advisors to the project team to learn about the study, review planning documents and provide feedback on the plan development. The group is also acting as ambassadors for sharing information about the study and encouraging participation. The PAC has met four times:
- July 2019 (included a tour of Digi Key!)
- October 2019
- June 2020
- August 2020

Stakeholder interviews
We conducted nine stakeholder interviews to identify current freight needs and issues in this area.
Questions included:
- Type of industry
- How their business uses and relies on freight system
- Economic factors (types of goods, vehicle types, typical routes)
- Identifications of freight system issues that most impact their business (policy-related, pavement conditions, route restrictions)
Online engagement
An online survey was distributed publically and included similar questions as the stakeholder interviews.
Responses:

32 total responses
were collected from our stakeholders and members from the community
Targeted Facebook advertisement:
- Distributed on MnDOT’s social media channels
- Ran for approximately two weeks
- 327 clicked on the link
- Over 14,500 people saw the ad on their newsfeeds at least once
We encouraged our project partners to also share this on their communication channels!

Economic Profile
More than half of all jobs in Northwestern Minnesota are in the freight industry. Overall, the region’s economy supports 53,444 jobs, with more than half (approximately 38,049 jobs) being freight-related jobs associated with the industries of manufacturing and wholesale and retail trade. This number is similar to Minnesota’s economy as a whole. Employment in these freight-related industries has risen substantially in recent years, growing nearly 50 percent from 2010 to 2017.
Freight employment
Check out each of the employment industries below.
Click the image above to enlarge.
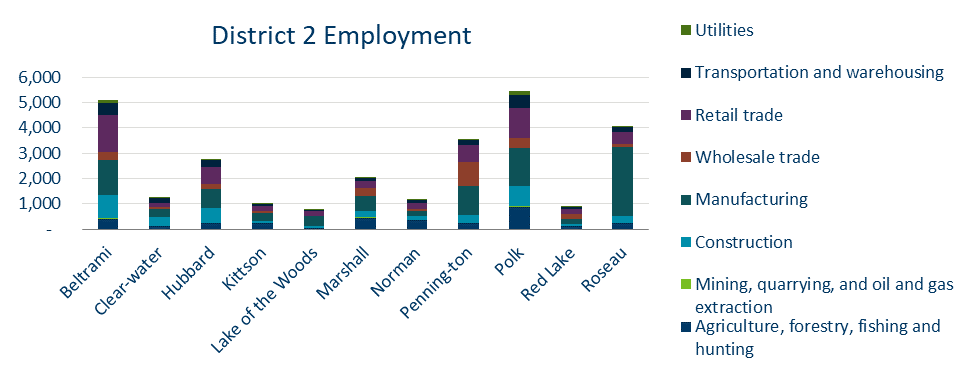
Freight jobs in District 2
The counties in the region with the highest levels of freight-related employment are Beltrami (5,087), Polk (5,461) and Roseau (4,072). These three counties account for more than half of all freight-related employment in the region:
- Beltrami: Freight-related jobs in this county are predominantly in the Retail Trade, Manufacturing and Construction sectors.
- Polk: While an overall small share of total jobs, this county has the highest employment in the Agriculture, Forestry, Fishing and Hunting sector.
- Roseau: Approximately 60 percent of freight-related employment in this county is within the Manufacturing sector. This is a result of large manufacturers, such as Polaris, located in the area.
Click the image above to enlarge.
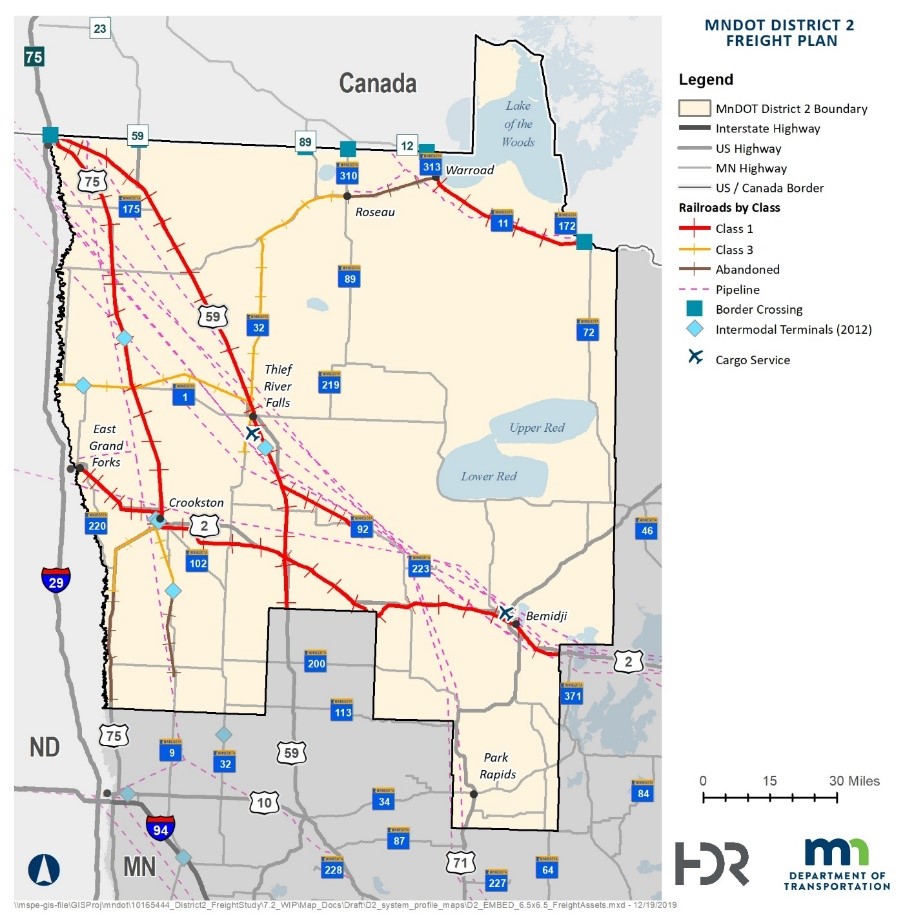
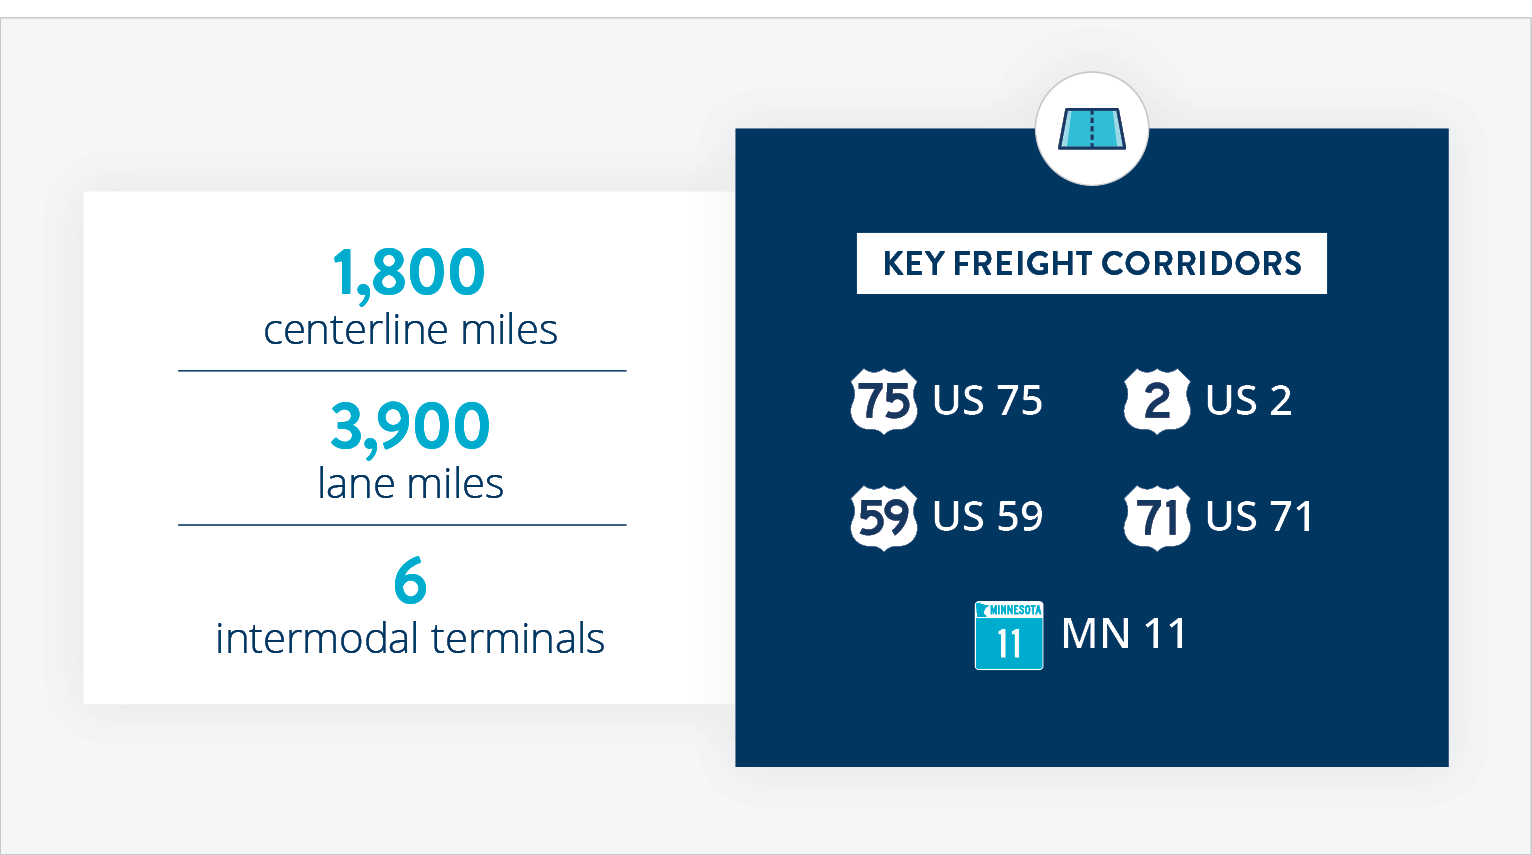
Freight System Profile
MnDOT District 2 is served by several freight modes including highway, rail, pipeline and aviation. We also has several border crossings into Canada and trade with Canadian industries makes up 28 percent of the state’s total exports, 41 percent of total imports and 36 percent of overall trade. However, the majority of this trade (94 percent by value) is conducted via ports of entry in bordering states such as North Dakota and Michigan.
As you read through the following slides, look for opportunities to View More. Clicking those blue dropdowns will let you see even more information and maps about this project.
View more: Multimodal Freight Network Map
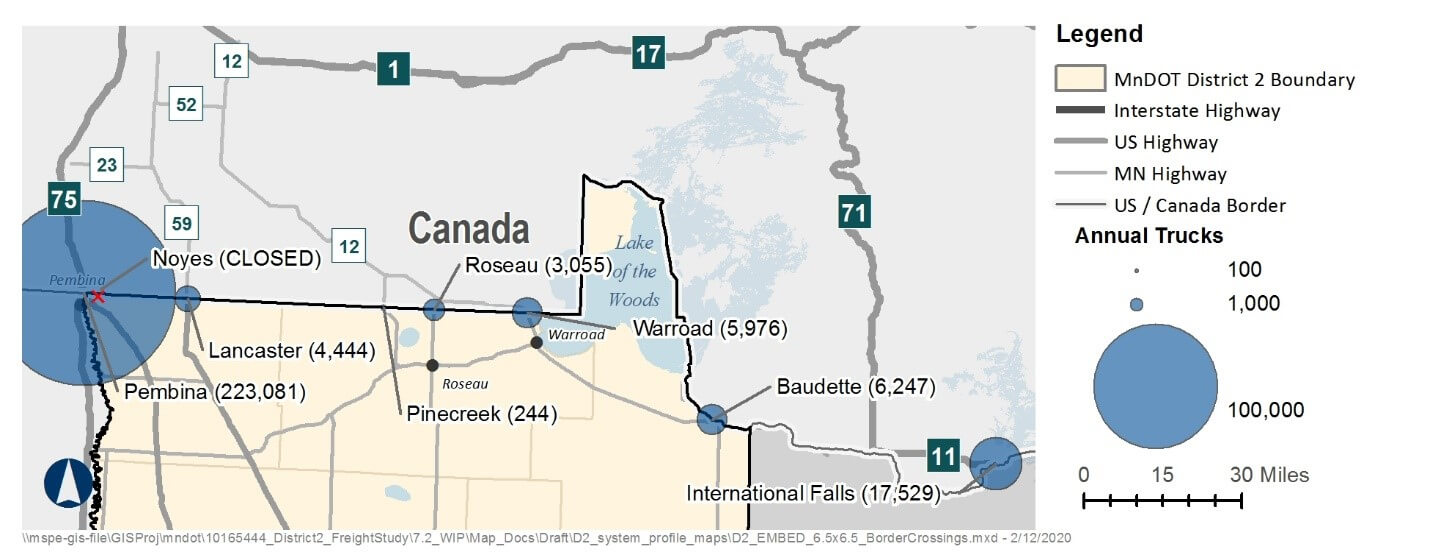
View more: Border Crossings Map
Freight transportation snapshots
You can read more detailed information about four freight mode listed below. Click a specific mode to see a snapshot of relevant information, or continue clicking through the slides.
Highway Snapshot
Traffic analysis
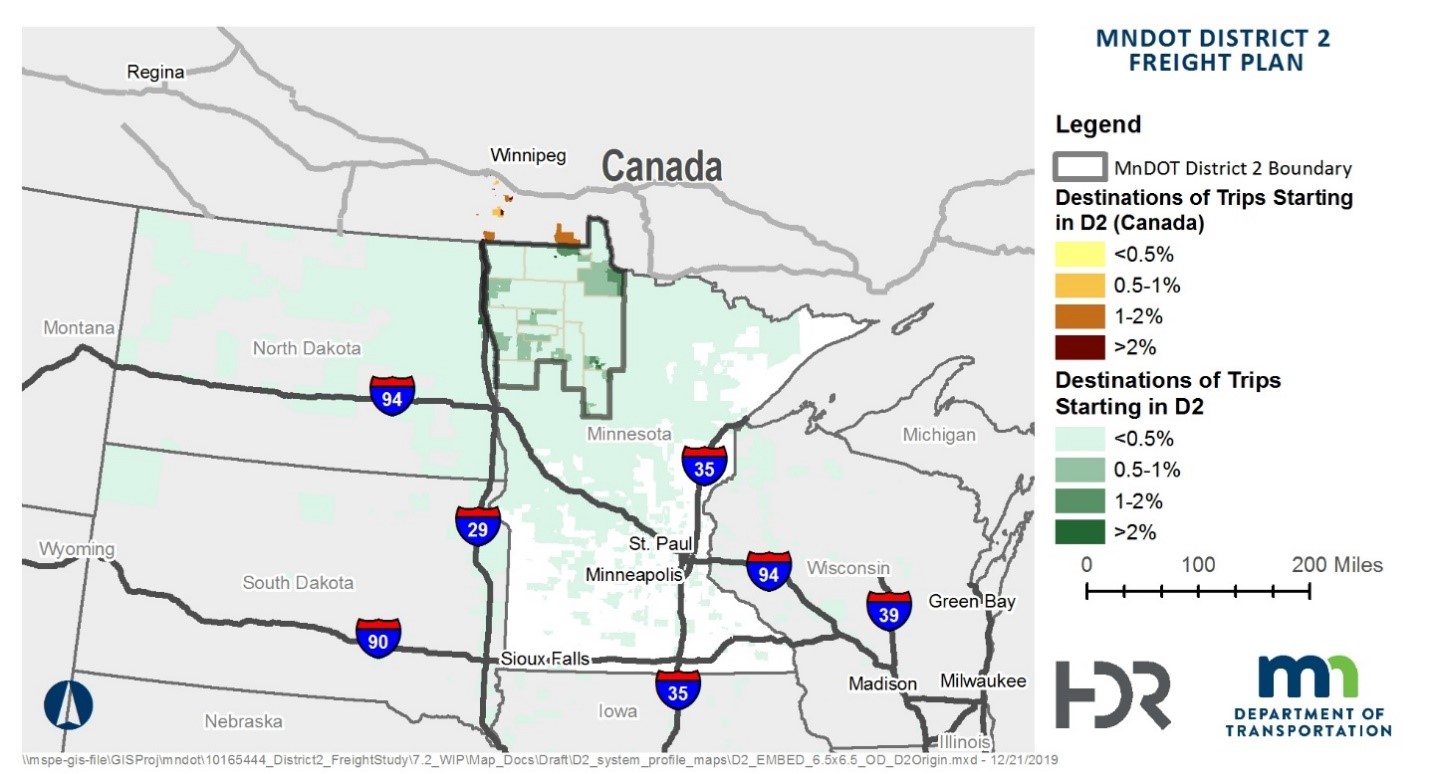
We analyzed traffic data to see where freight trips were starting and ending at. Findings showed:
- 75 percent of trips starting within the area also ended in the area, highlighting the large volume of local truck traffic.
- Trip destinations outside of the area extend throughout the Midwest, primarily in northern Minnesota, North Dakota and portions of Wisconsin and South Dakota.
- For trips originating in the region and travelling to Canada, more than half end near the CP Intermodal Yard in Winnipeg.
View more: Maps of District 2 freight trips
Map of the destinations of Freight Trips Originating in District 2
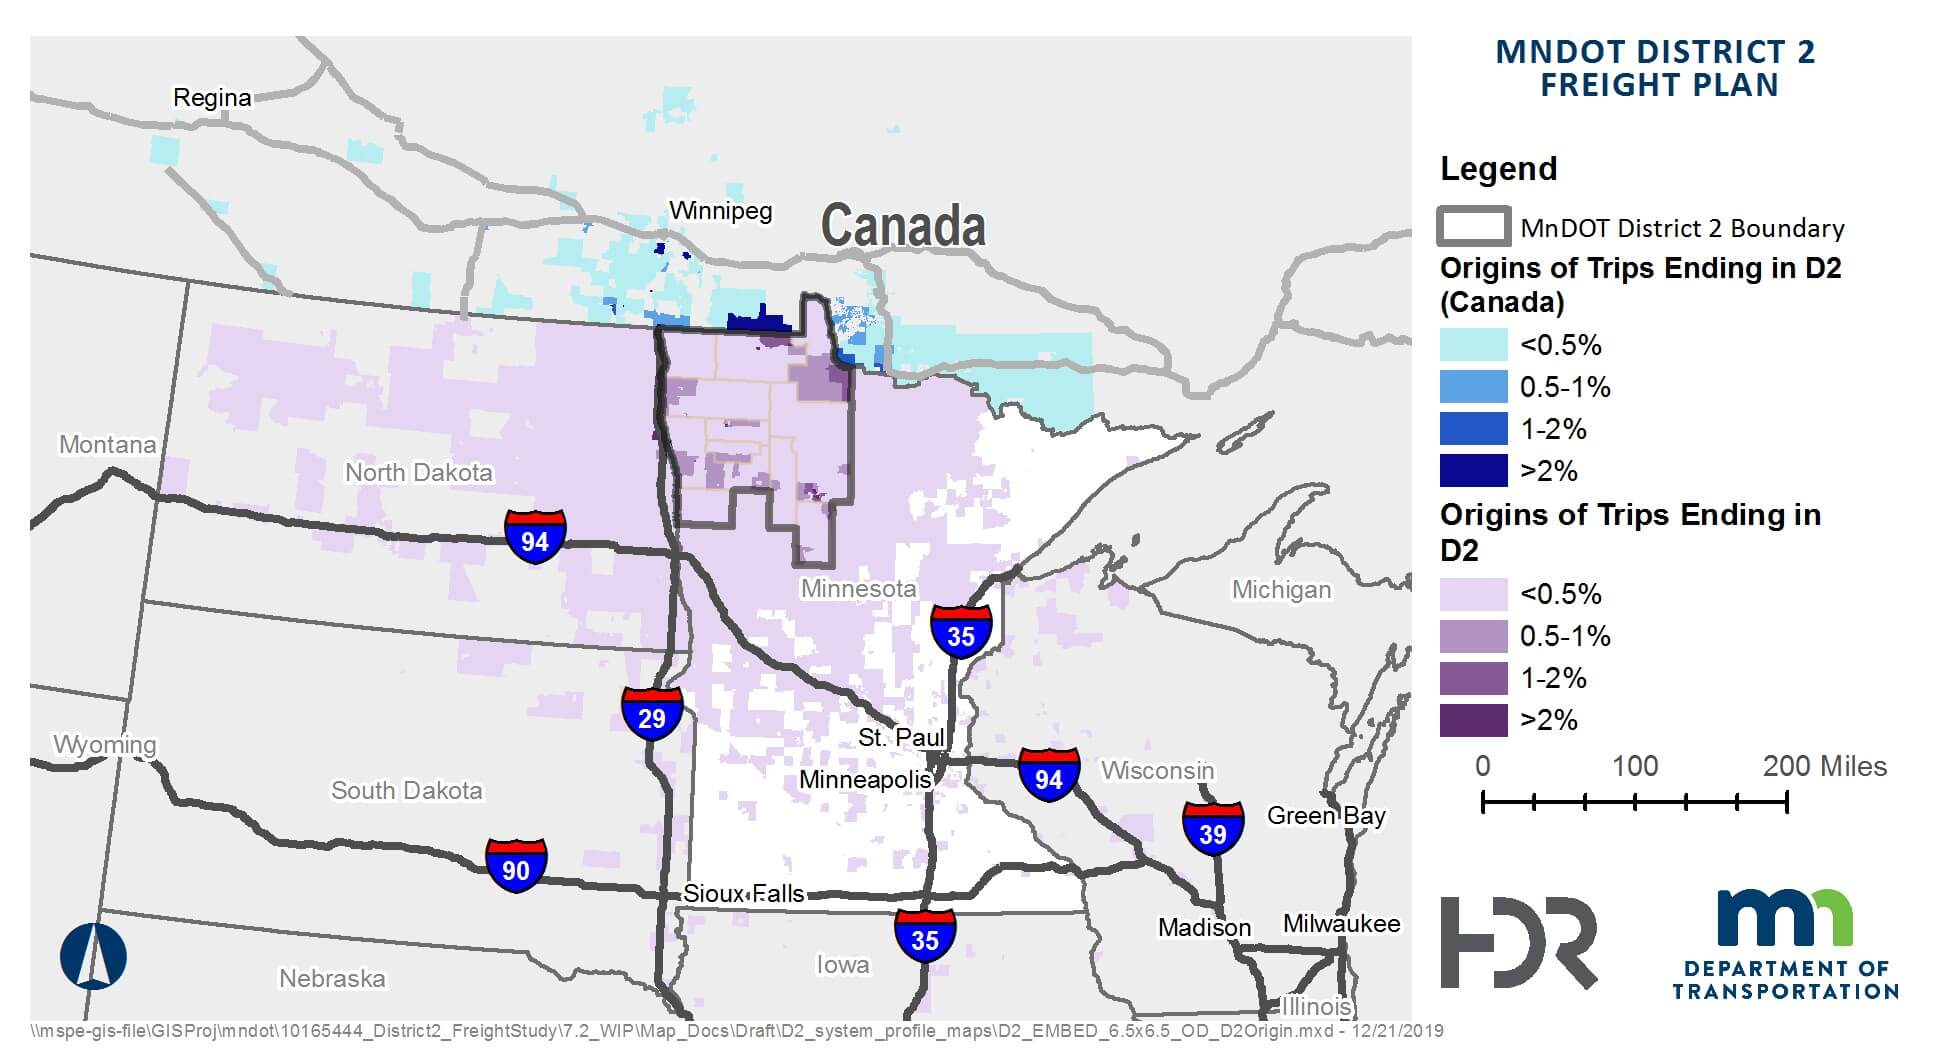
Map of the origins of freight trips ending in District 2
View more: About the data
StreetLight Insight was used to analyze trip origin and destination patterns for the region. StreetLight software utilizes cell phone location-based services data for personal vehicle traffic and INRIX truck GPS navigational data for truck trips (motor vehicles 14,000 lbs. or greater). The StreetLight Trip Index was the output type used to analyze origin and destination patterns. It can be used to measure the relative volume of trip activity, but does not estimate an actual count of trips or vehicles. Note also that the StreetLight Index values cannot be compared between countries due to varying sampling rates and analysis methodologies. Therefore, this analysis cannot provide a direct comparison of trips starting/ending in the US vs. trips starting/ending in Canada.
Of the trip volumes identified in the StreetLight data, 99 percent of block groups with trip volume either originating or ending in the region do not extend beyond the Midwest (extent shown on figures including Montana and Missouri). With a majority of truck freight trips for the region operating in the Midwest, some of the key corridors that support the region’s freight related movement are outside of the region: I-29, I-90, I-94 and US 2.
Click the image above to enlarge.
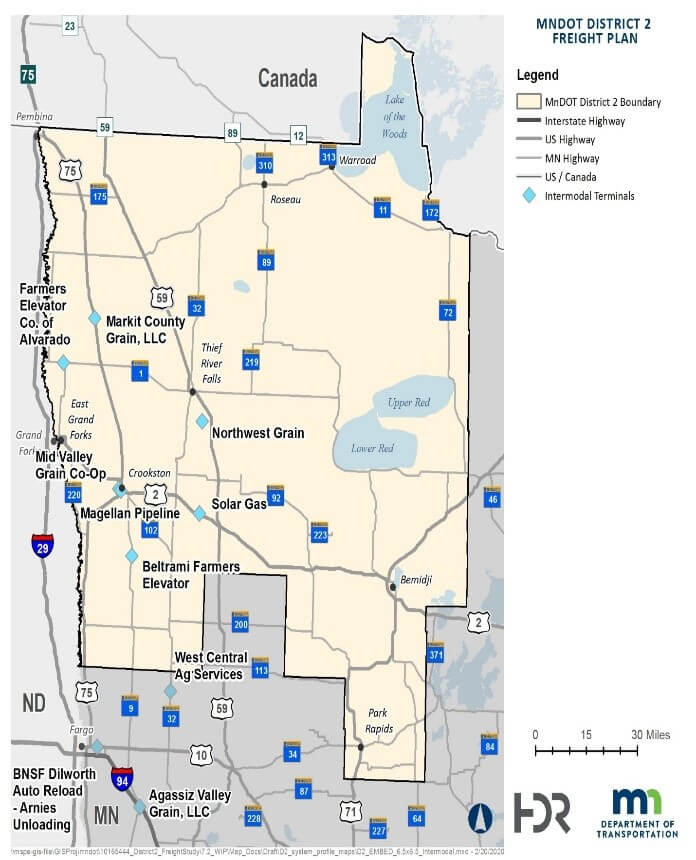
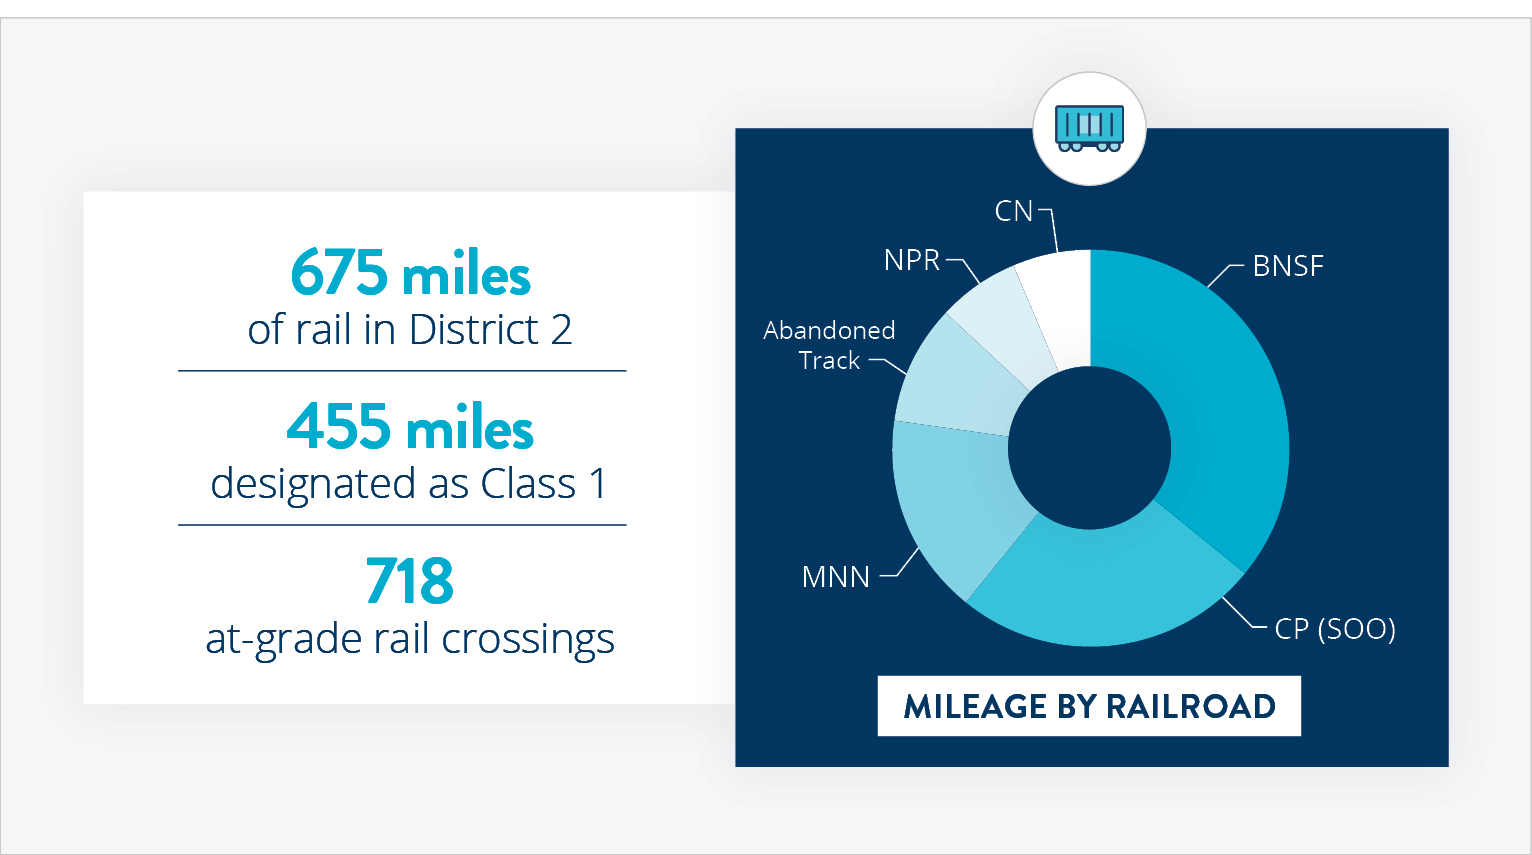
Railroad Snapshot
District 2 rail
Rail plays a crucial role in District 2’s movement of goods coming from the Bakken in North Dakota, heading to and from destinations such as the Twin Cities and across the nation. There are three Class 1 operators in District 2: BNSF, CN and CP. Class 3 operators include MNN and NPR. These lines run parallel to US highway routes US 75, US 59, and US 2.
View more: Intermodal facilities map
Click the image above to enlarge.
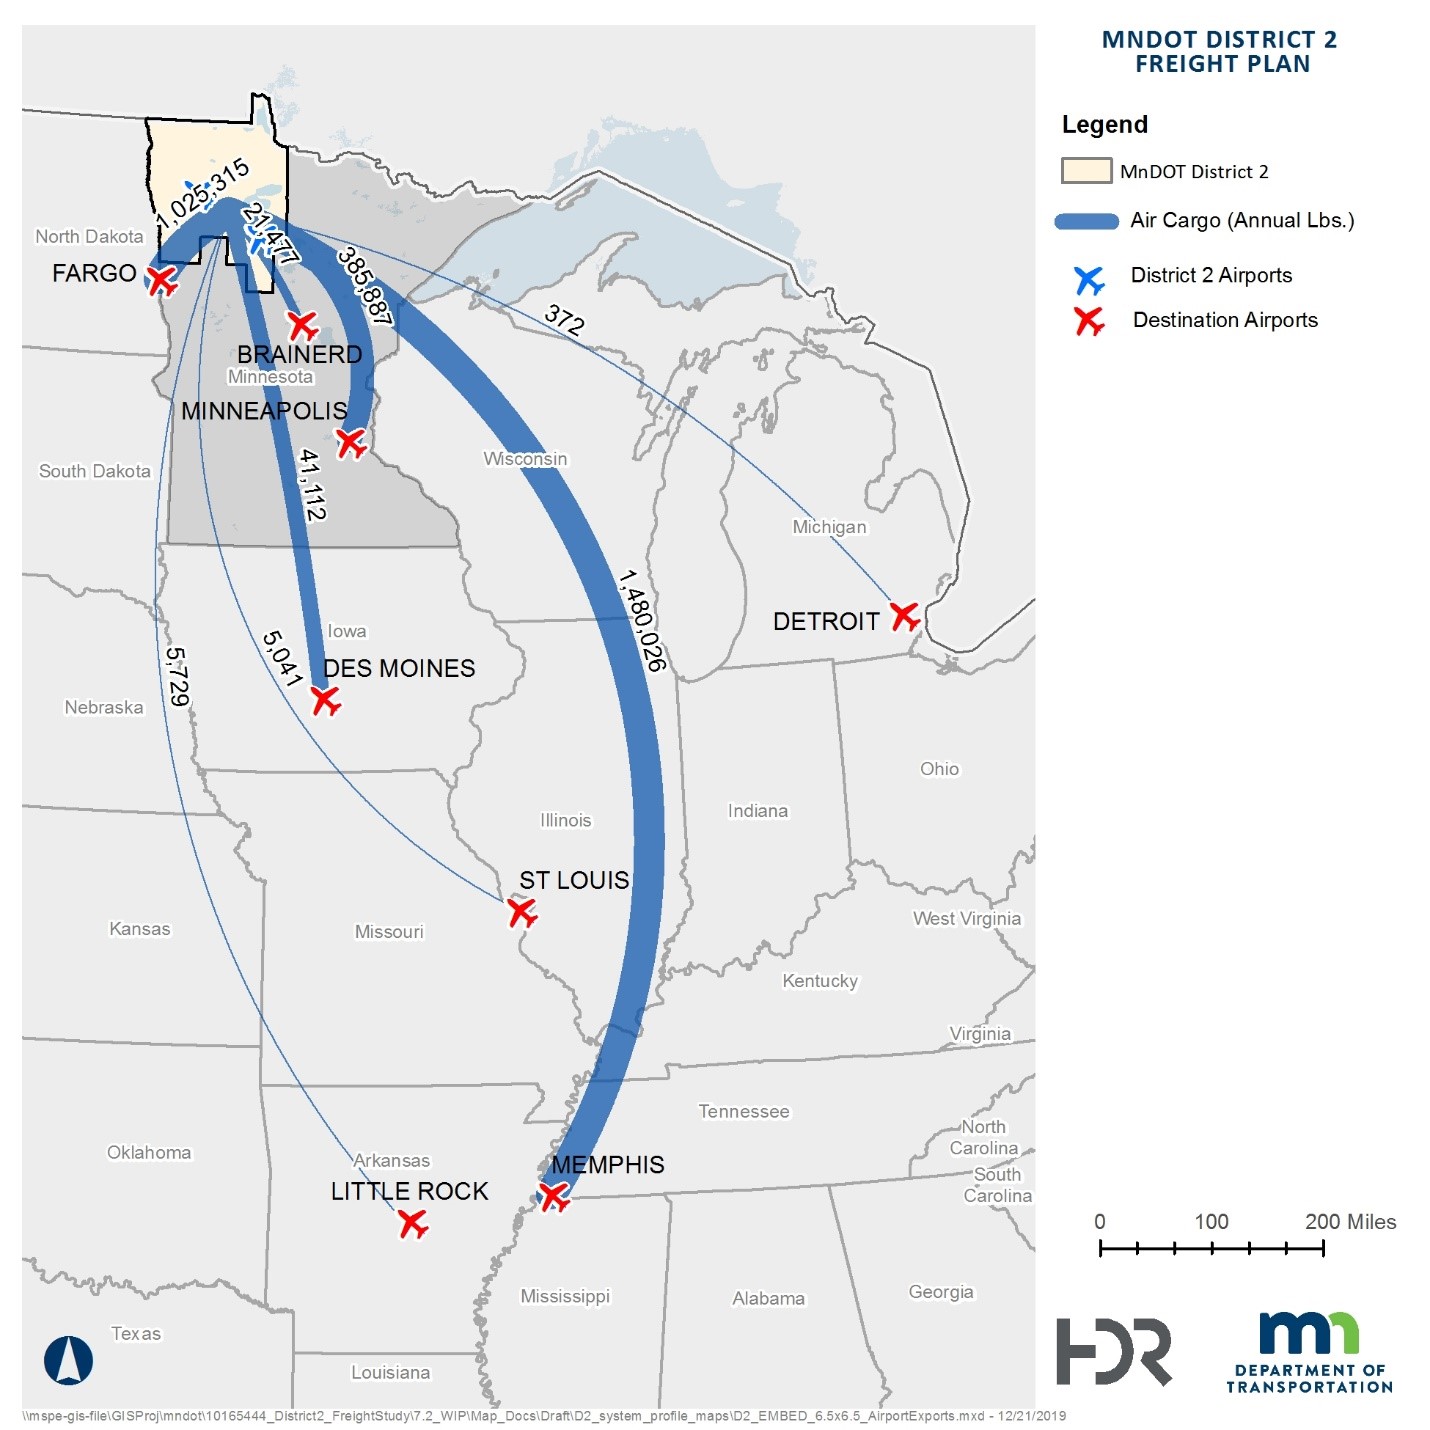
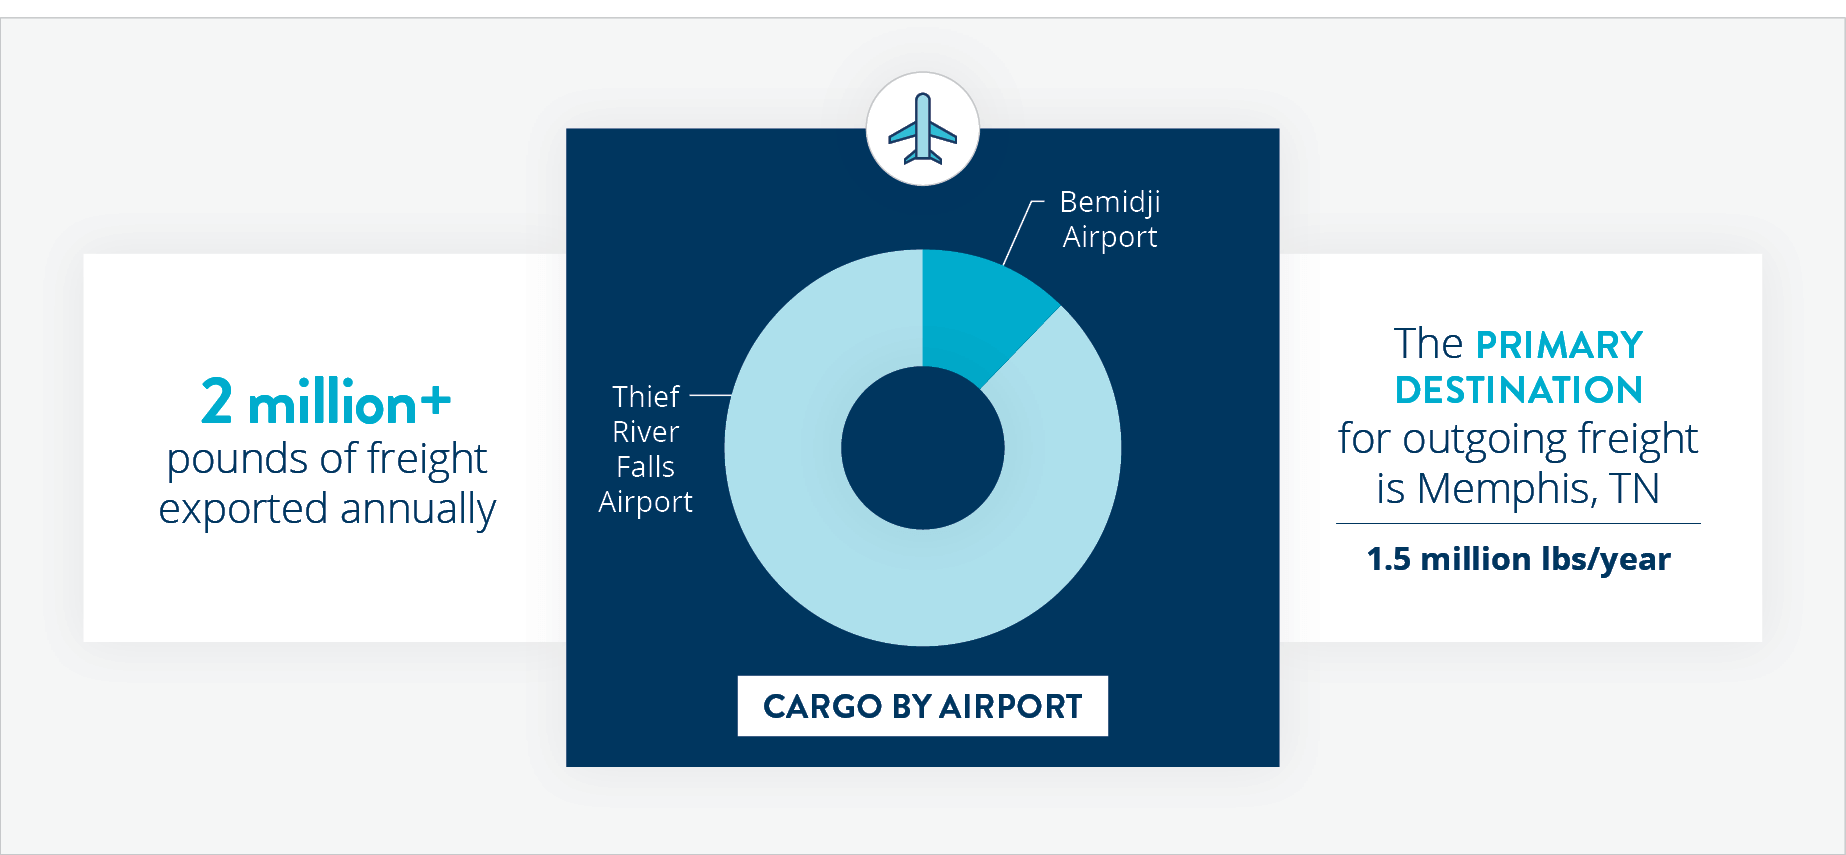
Aviation Snapshot
Increased aviation infrastructure
Freight aviation in District 2 is growing for both cargo and commercial use. Airports with cargo service are located in Thief River Falls and Bemidji. Both airports have seen substantial growth in in recent years. In the five years from 2013 to 2018, the volume of freight shipped out of the Bemidji airport grew 24 percent while the volume of freight shipped out of the Thief River Falls airport grew 305 percent.
Much of this growth is driven by local businesses such as DigiKey, an online-based electronic component distributor which uses air freight services to fulfill their e-commerce orders.
View more: Air cargo flows
Click the image above to enlarge.
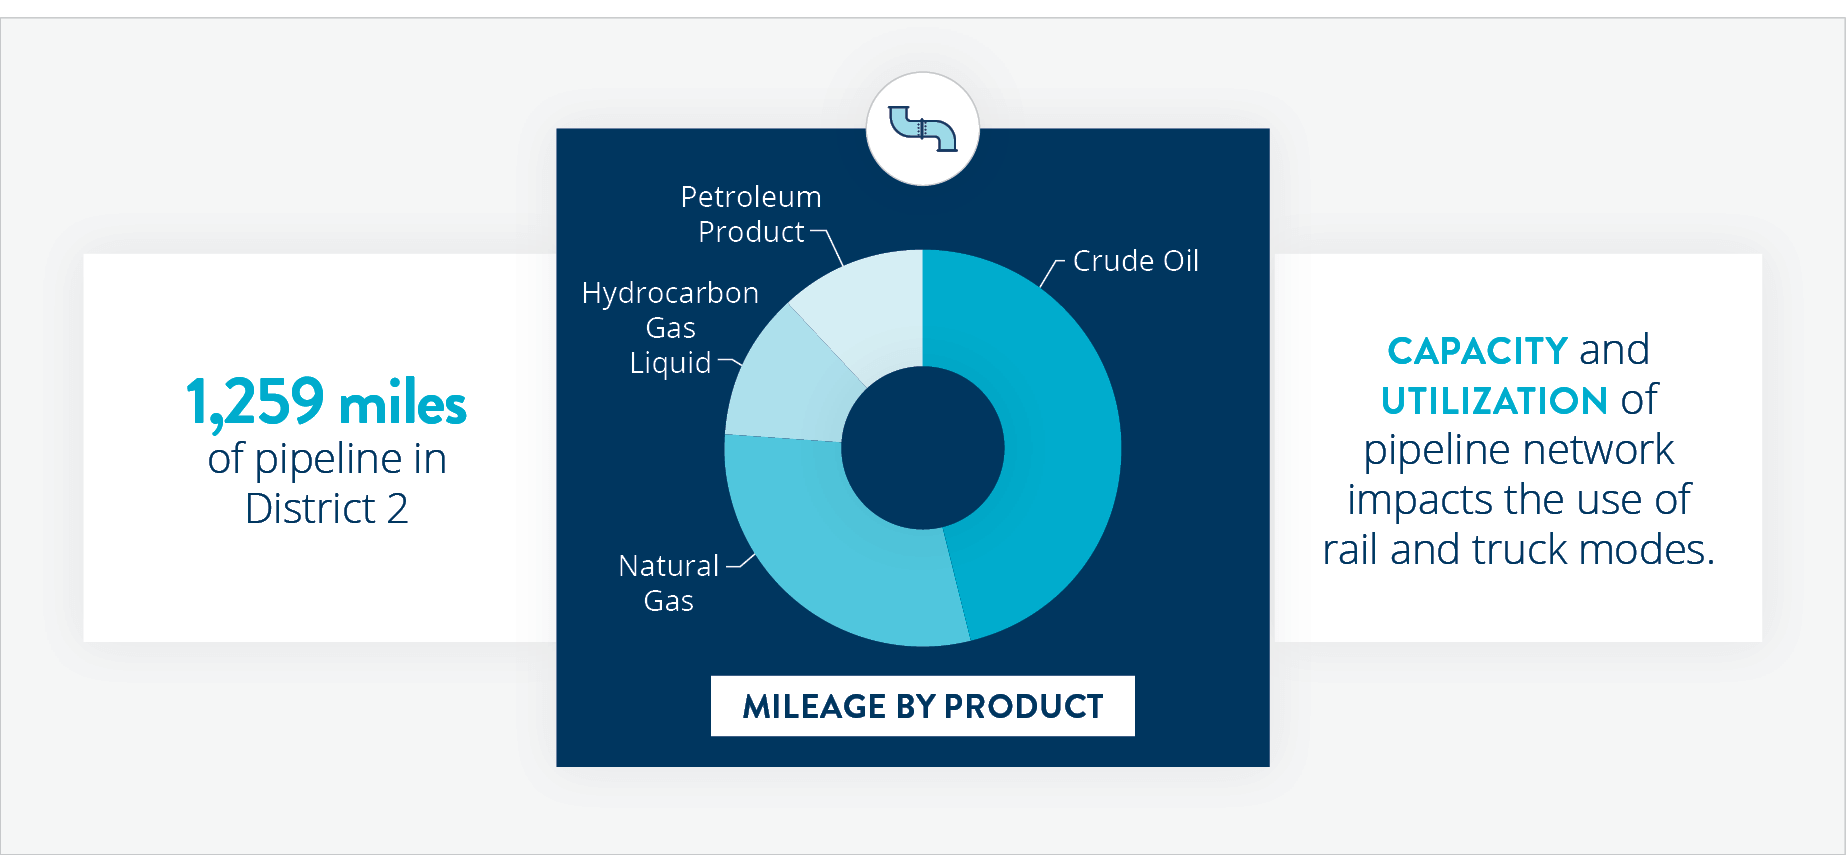
Pipelines Snapshot
MN pipeline infrastructure
According to the Energy Information Administration, about 30% of all U.S. crude oil imports enter the nation through Minnesota, largely by pipeline. Four categories of pipelines extend through District 2, totaling approximately 1,259 miles. While MnDOT has little direct influence on the development of pipeline infrastructure, the capacity and functionality of the pipeline network is important to understand as it can have significant impacts on other modes such as rail. For example, in the past year, the number of shipments of crude-by-rail has increased sharply in response to a number of bottlenecks in the pipeline network.
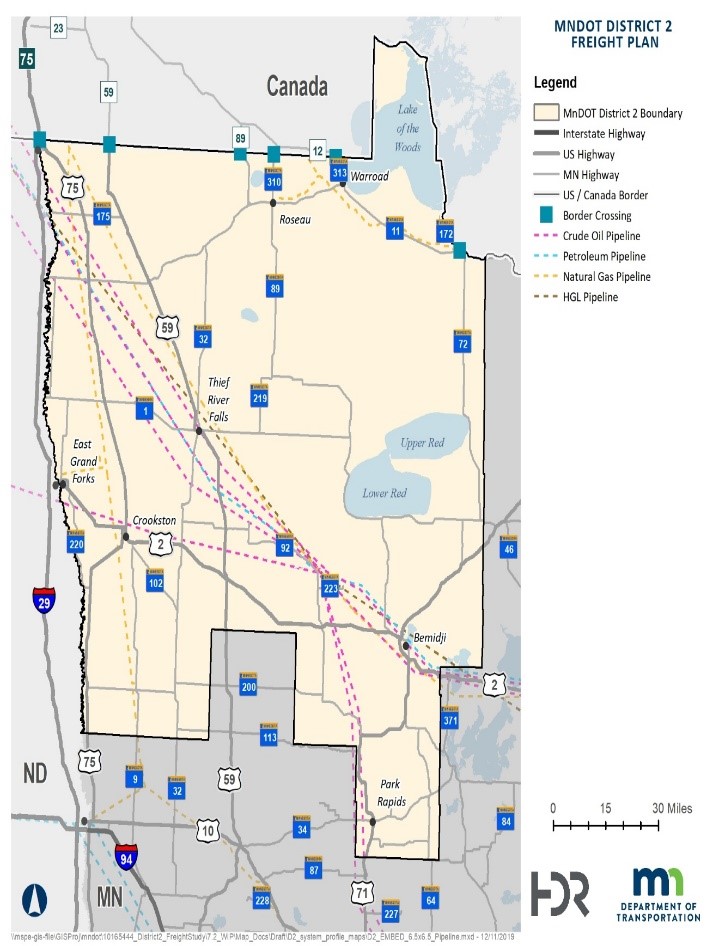
View more: District 2 pipeline map
Click the image above to enlarge.
Freight Needs
The results from the Freight Profile highlight the importance of infrastructure to the economy and related businesses operating in northwestern Minnesota. These findings will be combined with the input we received during the stakeholder interviews to help set the framework for future papers and future PAC meetings.
System profile key findings:
- Importance of Air Cargo: The airports at Bemidji and Thief River Falls handle more air cargo than any other airport in Minnesota with the exception of Minneapolis St. Paul Airport. The high quality air cargo service provided at these airports allows regional businesses to access national and international markets.
- Manufacturing Industries are Critical to the Region’s Economy: Manufacturing and freight-related businesses make up a larger share of the region’s employment than they do within the State as a whole. Industries such as agricultural and forestry products are uniquely important to the local economy.
- Limited Canadian Border Crossing Options: Many of the border crossings between District 2 and Canada have limited operating hours, forcing many carriers to detour to crossings outside the region such as Pembina and International Falls. This indirect routing increases travel time and shipping costs for the region’s businesses.
- Desire for Multi-Lane Highways: The region has no Interstate highways and has only limited segments of multi-lane highway. As noted by many respondents in the region’s Manufacturers’ Perspectives Study, expansion of some roadways to multi-lane configuration would increase safety and the efficient movement of goods.
Click the image above to enlarge.
Prioritization
The identification of freight needs in the region relies on a variety of sources including the work completed and summarized in our Working Papers, interviews with freight area businesses and coordination with the Project Advisory Committee. The intended purpose of this approach is to combine our data with more qualitative methods (interviews and survey) to develop a comprehensive list of freight needs and issues within the region.
Freight need categories
The list of freight needs identified during the data analysis and stakeholder outreach was categorized into three categories.
- Safety:
- Determined primarily based on crash history over the past five years for highway-related crashes and the past 10 years for crashes at highway-rail grade crossings.
- Identified using risk factor analysis developed by MnDOT in previous studies.
- Mobility:
- The ability of freight carriers to move freight throughout the region, including several factors such as travel time reliability, bridge weight limits and low bridge vertical clearance issues.
- Condition:
- Maintaining freight infrastructure at an adequate condition level is critical to ensuring the long-term viability and trust in the freight transportation system.
- Includes freight needs based on MnDOT’s bridge condition and pavement quality data.
By comparing needs and programmed projects, this analysis identifies areas where freight needs are not currently being addressed. The map below overlays the locations of all identified freight needs with the locations of programmed transportation improvements.
Many of the locations of need have programmed projects scheduled to occur in the area of identified need. Notable examples include US 75 south of Pembina, MN 200 between Mahnomen and Zerkel and many portions of US 2. However, there are also many areas of need which are not currently being addressed, including multiple locations with poor bridge conditions and many parts of US 59 from the Canadian border to Thief River Falls.
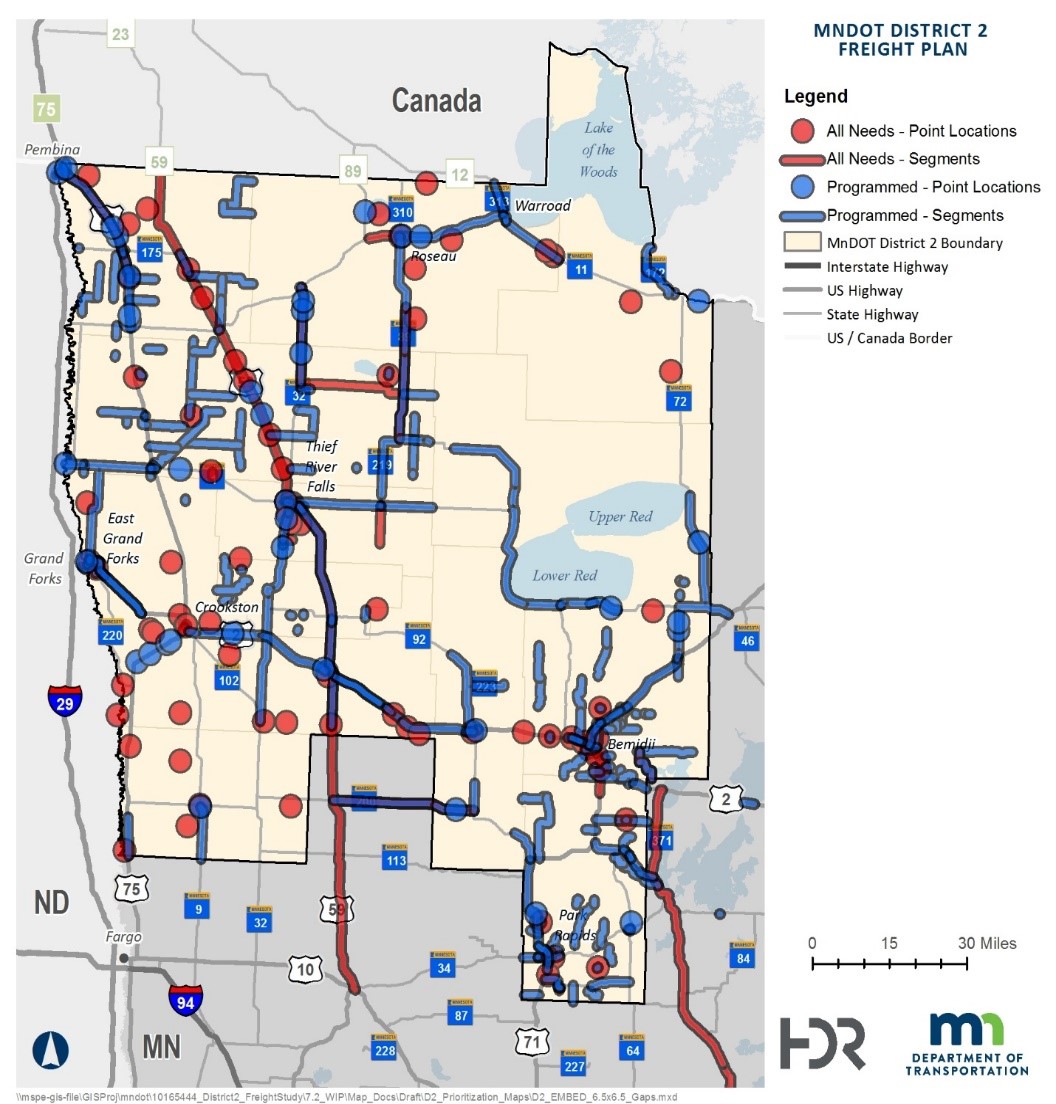
Click the image above to enlarge.
Where We Ended Up
Using the information outlined on the last slide, the 40 top ranked locations were reviewed to assess whether they should be considered for conceptual analysis and cost estimation. A total of 10 issues were selected from this list. The team also identified an additional five locations that have known freight issues or have planned future construction projects that would benefit from additional review through the lens of freight analysis.
Explore the map below to see selected locations for additional analysis.
Map legend
| Roadway | Issue Identified | |
|---|---|---|
 |
3rd St NW | Intersection with high crash density |
 |
Central Ave | Intersection with high crash density |
 |
Main Ave | Trucks have difficulty with signal/turn onto city street |
 |
E Main St | Intersection with high crash density |
 |
Demers Ave | Intersection with high crash density |
 |
USTH 75 | Bypass lane requested due to high truck traffic |
 |
220th St NW | Turn Lane from 220th ST from TH 1 WB |
 |
USTH 2 | Intersection with high crash density |
 |
Anne St NW | Intersection with high crash density |
 |
MN 87 to RP 47 | Curves/Shoulders |
 |
MN 11 to RP 75 | Curves |
 |
US 71 to RP 264 | Truck Route Access |
 |
US 59 to RP 356 | Shoulder Width |
 |
MN 371 to RP 91 | Truck Bypass Suggested |