Welcome
Welcome to the District 6 Freight Plan virtual open house! Many of you may have visited our last online open house or you may be just learning about this project for the first time.
This study is looking at the freight transportation system in Southeast Minnesota to better understand the trends, issues and needs of the area.
The draft plan is ready for review! Please view the document and then visit the Input Opportunity slide to share your feedback by March 21.
About this online open house
Today you will learn more about the District 6 Freight Plan, our initial findings about this area and our project prioritization recommendations. You will also have an opportunity to provide your feedback.
The entire session should take no more than 15 minutes to complete.
- Navigate: Continue clicking through to learn more about the District 6 Freight Plan. Use the navigation bar on the left side of the screen by clicking on the text to advance to the next slide or use the arrows along the bottom of the screen to go back and forth between slides.
- Comment: Provide a comment at any point by clicking the “Comment” button at the top right of your screen. Once finished, please make sure to hit "Submit" to confirm that your comment is sent to the project team. Close the form to continue through the slides.

Tell Us About Yourself
How do you use this area of the state?
Let's start by getting to know you a little better! Please take a minute to answer the following survey questions to help us understand how you use this area of the state.
When completing each of the survey included here, please hit the green "Submit" button before continuing on through the slides. This ensures that your answers will be recorded. Thank you for your input!
See the study area
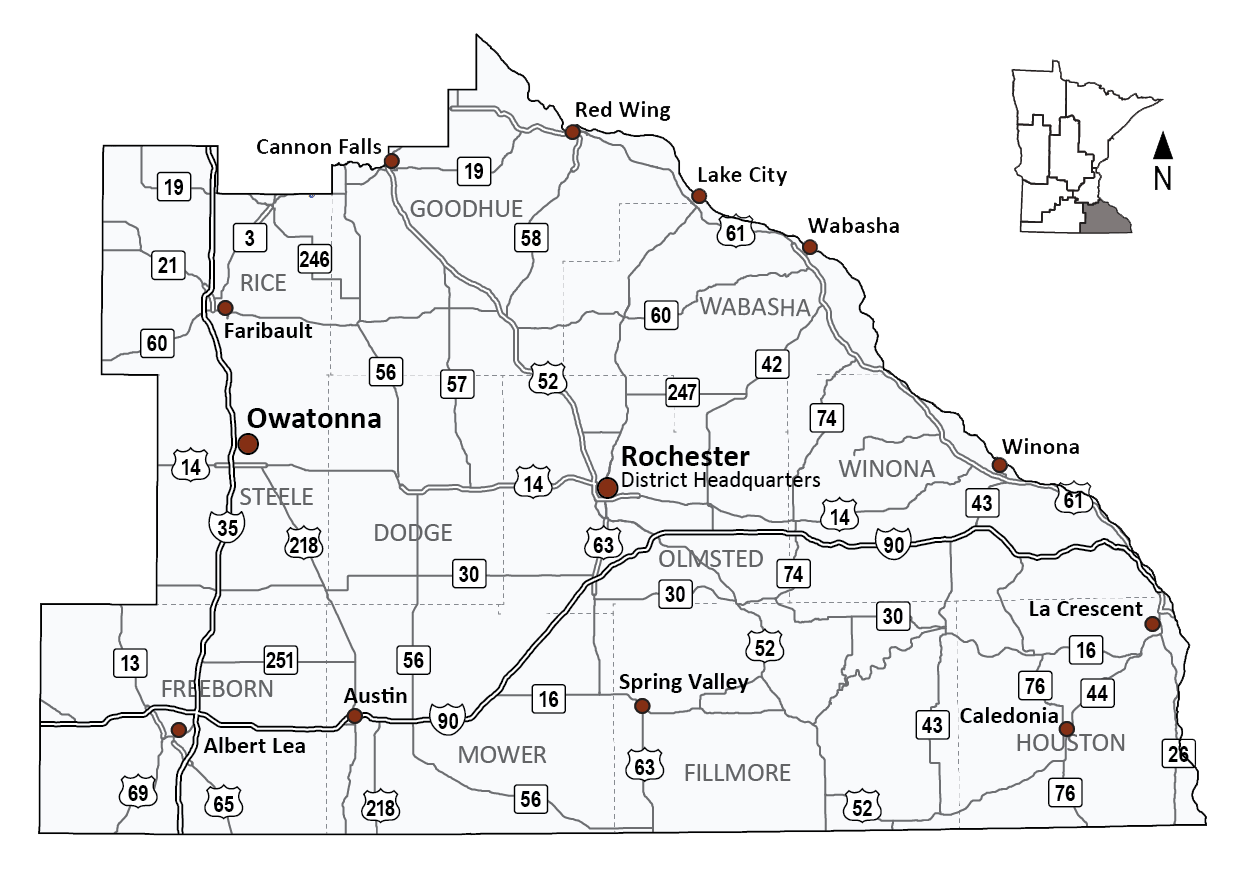
Click the image above to enlarge.
Your feedback — Survey questions
MnDOT District 6 Overview
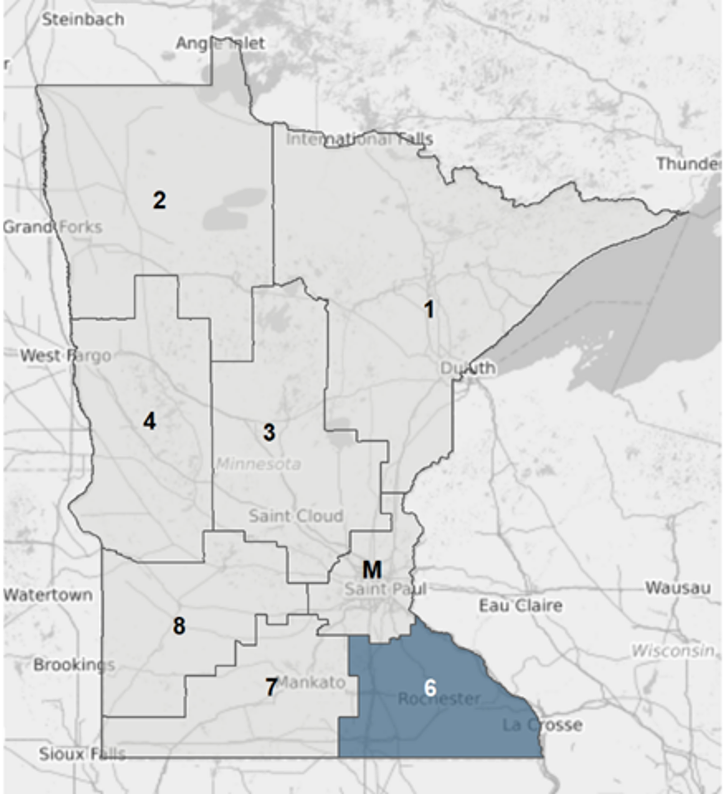
MnDOT is divided operationally into eight regional Districts
Each District plans, designs, constructs, and maintains the state and federal highways within that respective District. Additionally, the Districts manage the aid and assistance provided to local governments that qualify for state and federal transportation funding for roadways, bridges, trails, and transit systems.
Learn more about MnDOT District 6
District 6 is in Southeastern Minnesota and consists of the following counties: Dodge, Fillmore, Freeborn, Goodhue, Houston, Mower, Olmsted, Rice, Steele, Wabasha, and Winona.
Rochester, the state's third-largest city after the Twin Cities, is in District 6. The city also contains the largest Mayo Clinic campus, an internationally recognized medical center.
Facts about District 6
Study Overview
The Minnesota Department of Transportation is currently in the process of creating a Freight Plan for Southeast Minnesota that will identify opportunities to improve freight infrastructure for all modes that use the system in this area. These future investments will increase the economic competiveness of the region. The Plan will prioritize freight-related projects and develop initial designs and cost estimates for high priority projects.
Study Recommendations
The District 6 Freight Plan recommendations will:
Provide an understanding of the
current multimodal freight system
Expand on existing studies and plans using
current data and analysis to identify area freight priorities
Help MnDOT understand how local industries
use the system and their needs and issues
Identify opportunities for public and private
stakeholders to give their input
Guide MnDOT District investments to improve the multimodal freight system including roadways, railroads, regional airports and pipelines
Integrated Freight Planning
The Plan also needs to integrate and align with statewide freight planning efforts. Take a look at the flow chart below to see how recommendations from this plan could advance to become part of the Minnesota Highway Freight Program.
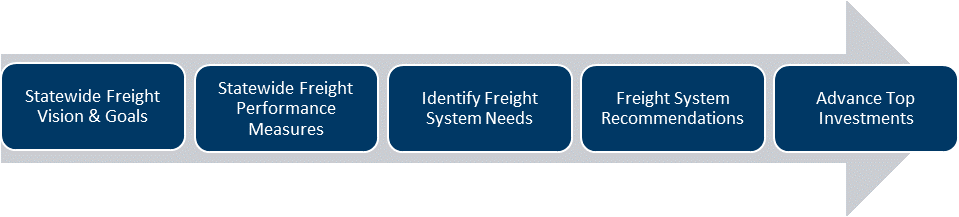
Click the image above to enlarge.
Engagement Summary
Our team has been virtually engaging with the communities and stakeholders in Southeast Minnesota to gather input that helped our team develop the Plan. Information about our engagement efforts is shown below.
Project advisory committee
We have a committee of freight and public stakeholders serving as advisors to the project team to learn about the study, review planning documents and provide feedback on the plan development. The group is also acting as ambassadors for sharing information about the study and encouraging participation.
The PAC has met virtually four times:
- April 2021
- July 2021
- January 2022
- March 2022
Stakeholder interviews
We conducted nine stakeholder interviews to identify current freight needs and issues in this area.

Questions included:
- Type of industry
- How their business uses and relies on freight system
- Economic factors (types of goods, vehicle types, typical routes)
- Identifications of freight system issues that most impact their business (policy-related, pavement conditions, route restrictions)
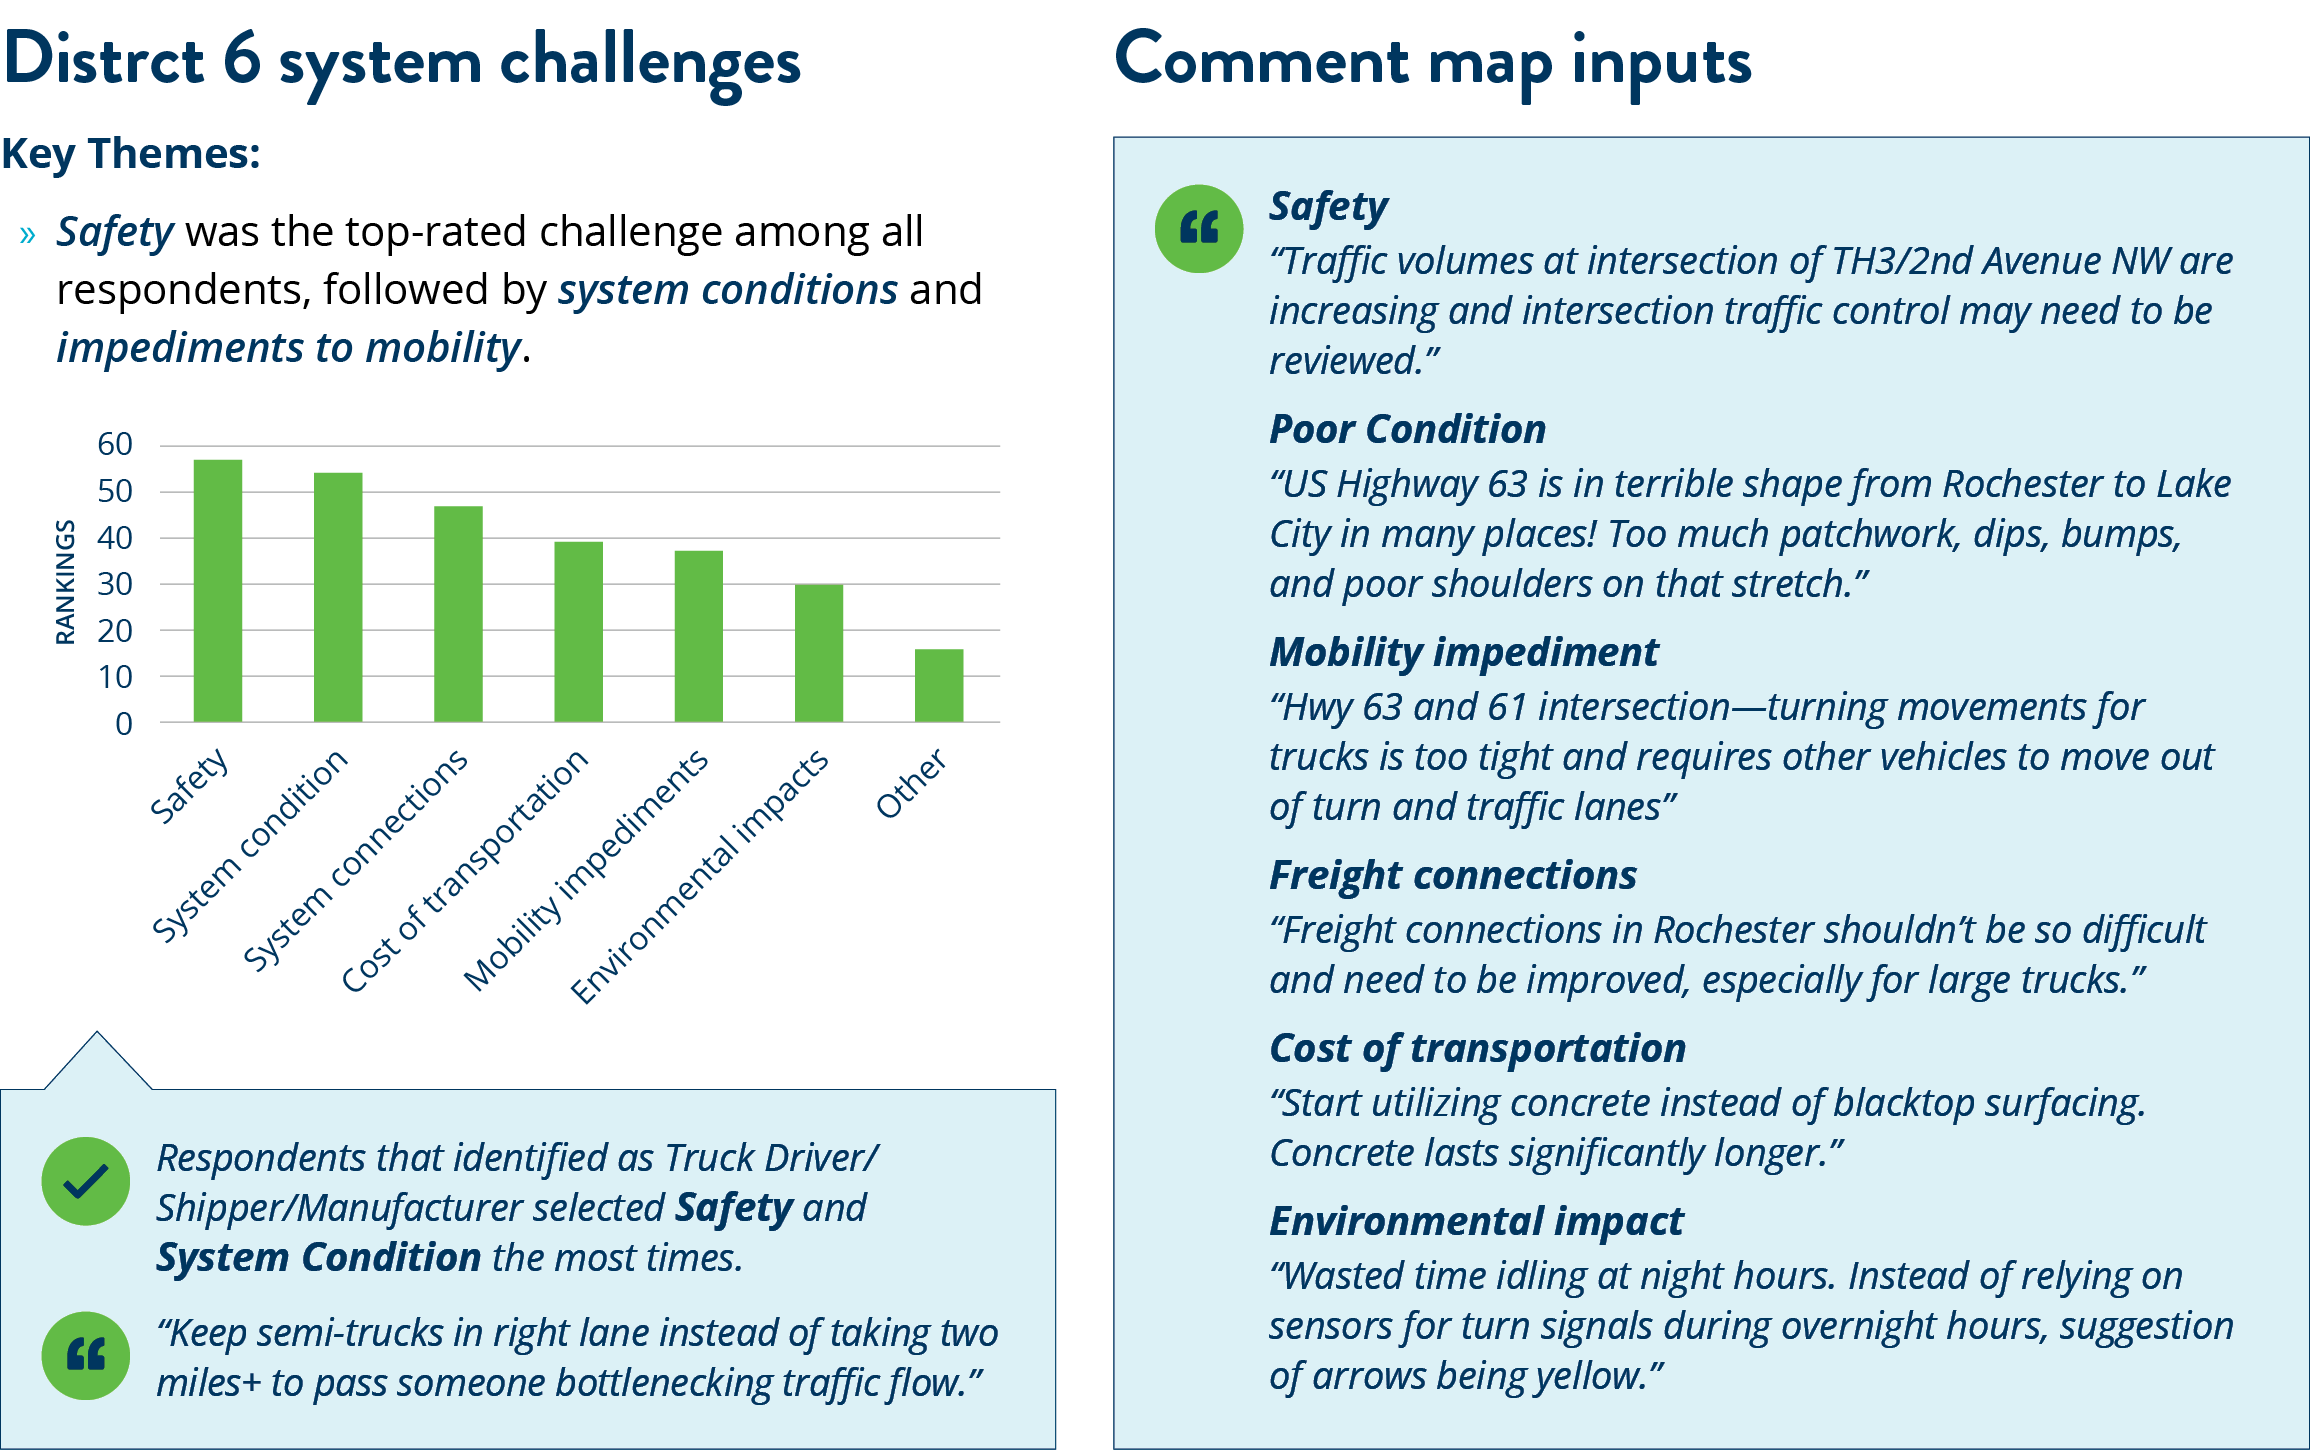
Online engagement
- September through October of 2021
- 385+ visitors
- 245+ comments
- 1,050+ data points from our survey
Click here to see our results!
Takeaways and Understanding
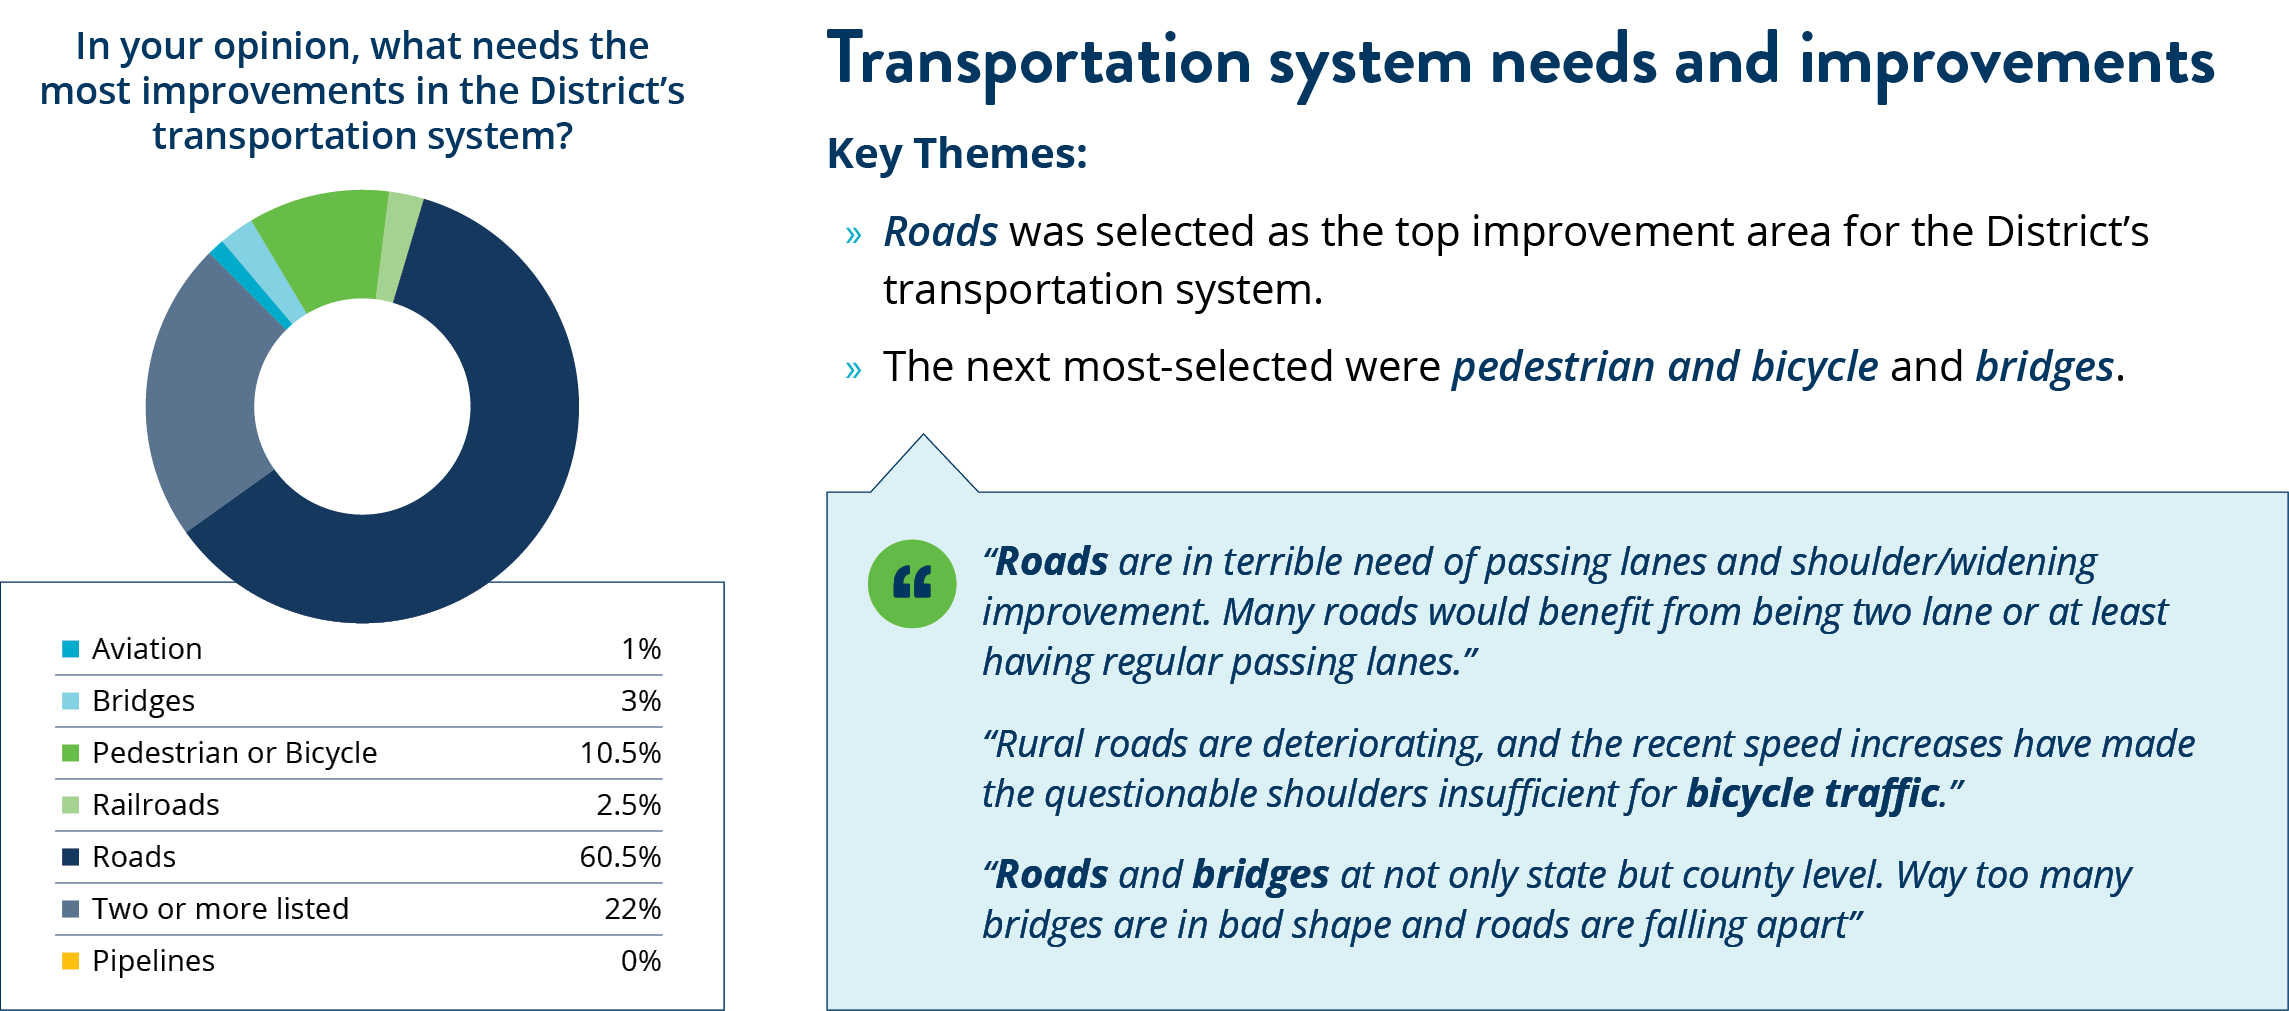
Click the image above to enlarge.
Economic Profile
We took a look at the District 6 economy and workforce to better understand the key drivers of freight activity in the region.
The District 6 economy is strongly supported by industries that rely on the transportation of goods, due in part to the significance of Grain and Oilseed Milling and Breakfast Cereal Manufacturing industries. Understanding statewide and regional trends will help identify strengths, weaknesses, and opportunities for investment in the freight system future.
The District’s three largest employment categories are:
Health Care/Social Services
Manufacturing
Professional Services
Key Takeaways
Freight-related industries contribute to 38.4% of District 6’s Gross Domestic Product (GDP).
The industry with the largest share of GDP in District 6 is Health Care and Social Services at 22.3%. This is more than twice that industry’s share of GDP in the state.
The District 6 economy supports approximately 233,000 jobs across all industries.
Freight-related industries employ 37% of the workforce in District 6.
District 6 Freight System Overview
We took a look at the District 6’s freight system to better understand how each modal type operates to identify the connections in the multimodal freight system.
District 6's major freight transportation investments primarily focus on highways and railroads, but goods are moved by multiple modes throughout the area! Click each mode below for a snapshot of relevant information.


Click the image above to enlarge.
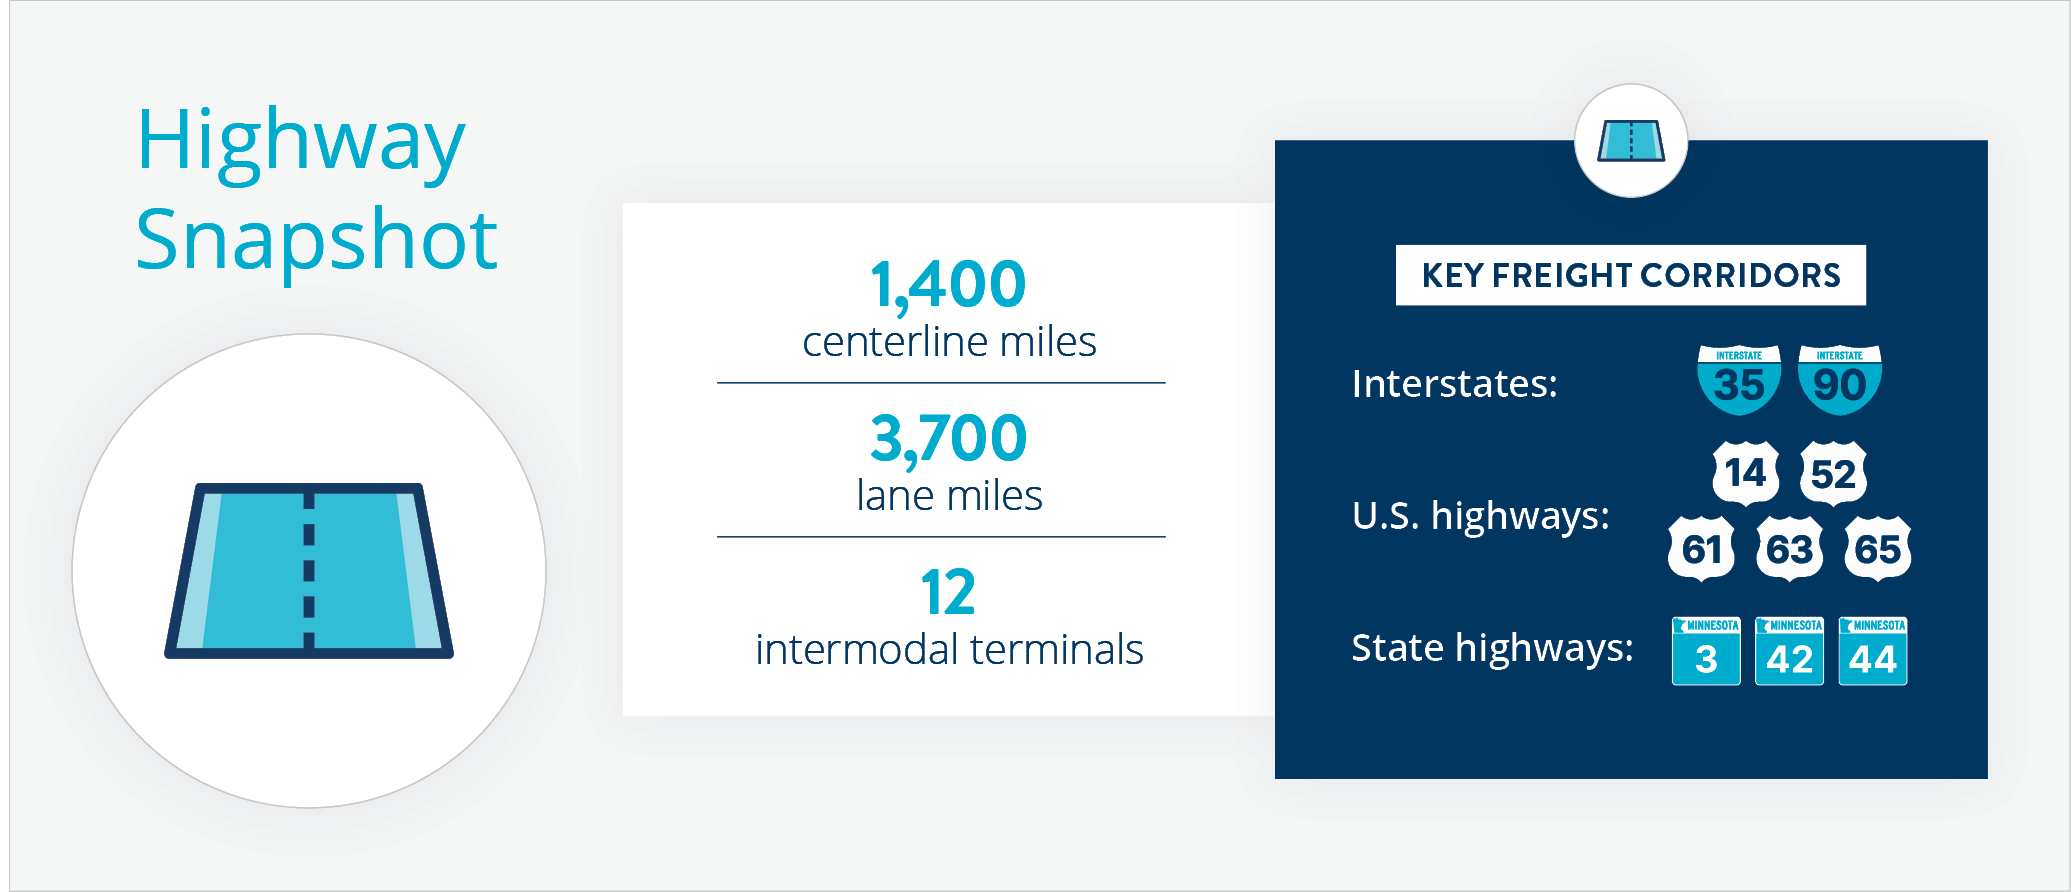
Highway Snapshot
Traffic Analysis
We analyzed traffic data to see where freight trips were starting and ending at. Findings showed:
- A large proportion of truck trips that start within the District also end within the District. Nearly two-thirds of the District's truck trips are “in-District” trips. Key connecting areas for inbound and outbound District 6 truck trips include Sioux Falls, Lincoln, Des Moines, Kansas City, and Madison.
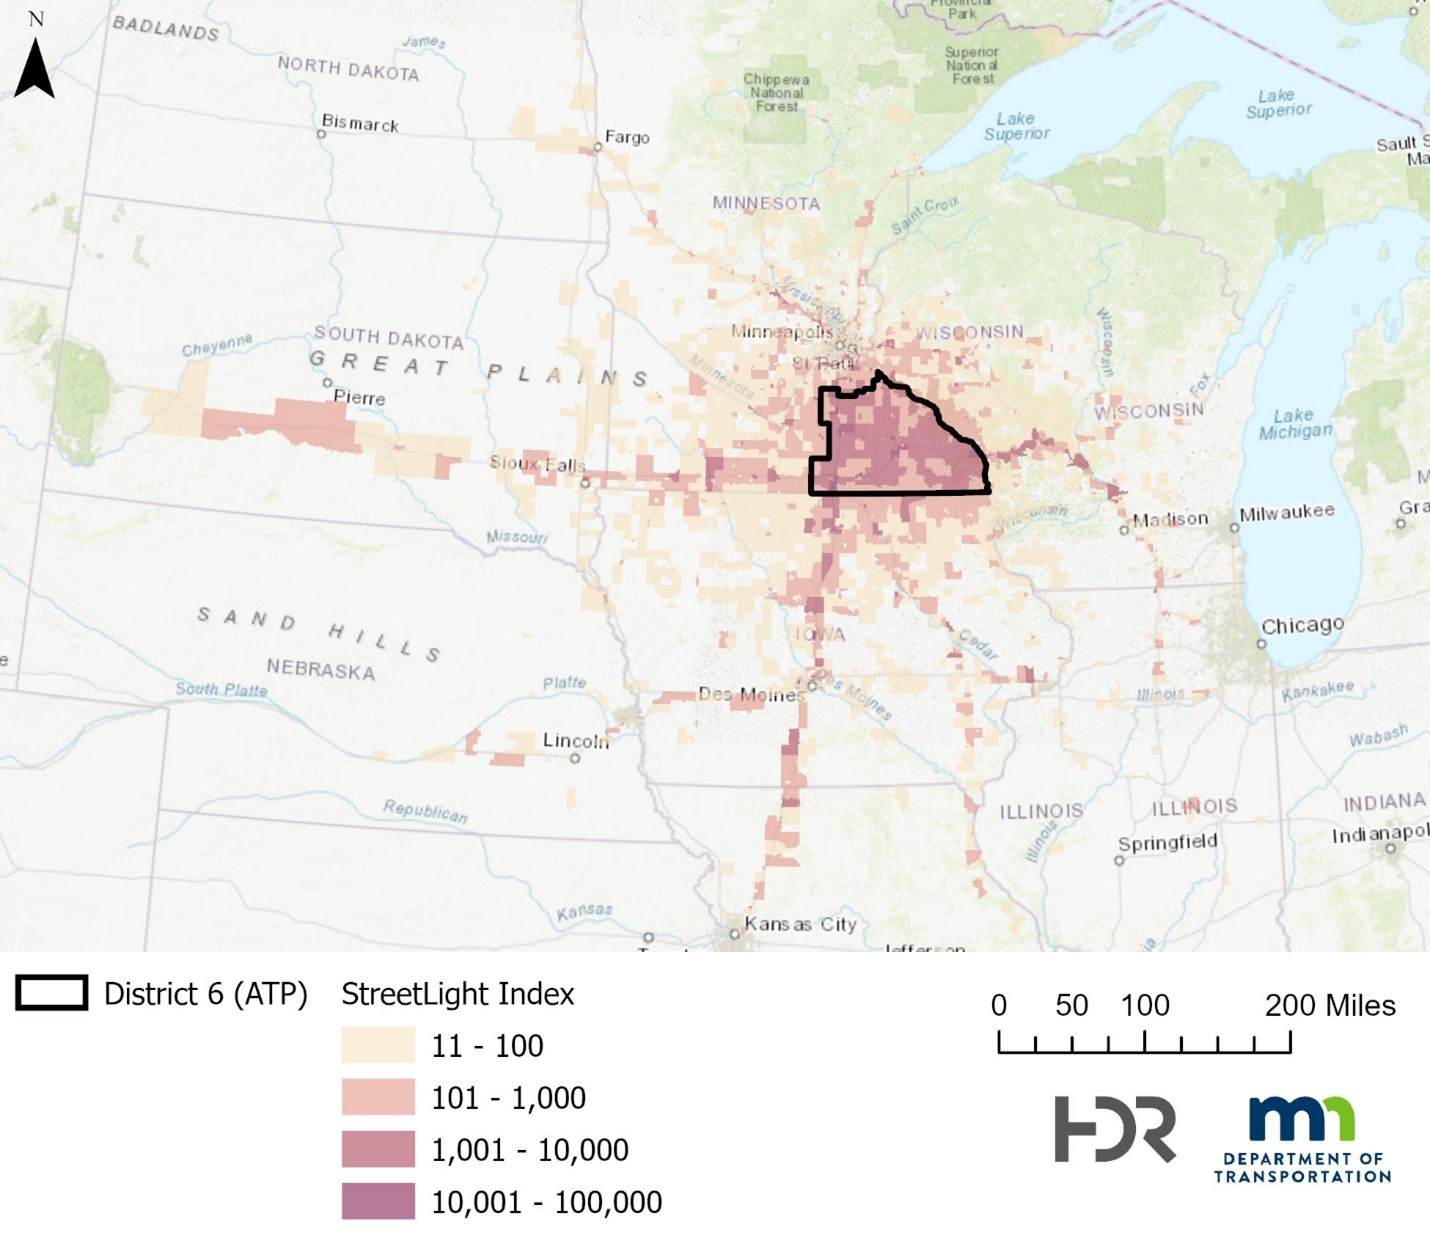
View More: About the data
StreetLight Insight was used to analyze trip origin and destination patterns for the region. StreetLight software utilizes cell phone location-based services data for personal vehicle traffic and INRIX truck GPS navigational data for truck trips (motor vehicles 14,000 lbs. or greater). The StreetLight Trip Index was the output type used to analyze origin and destination patterns. It can be used to measure the relative volume of trip activity, but does not estimate an actual count of trips or vehicles. Note also that the StreetLight Index values cannot be compared between countries due to varying sampling rates and analysis methodologies. Therefore, this analysis cannot provide a direct comparison of trips starting/ending in the US vs. trips starting/ending in Canada.
Click the image above to enlarge.
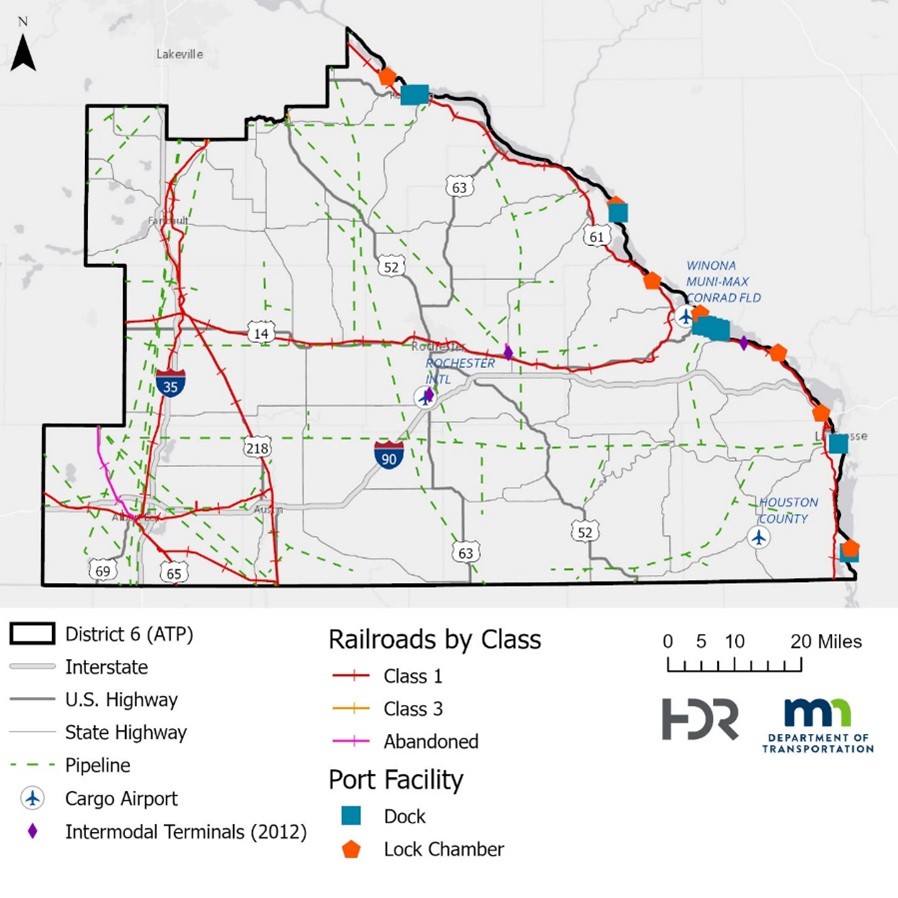
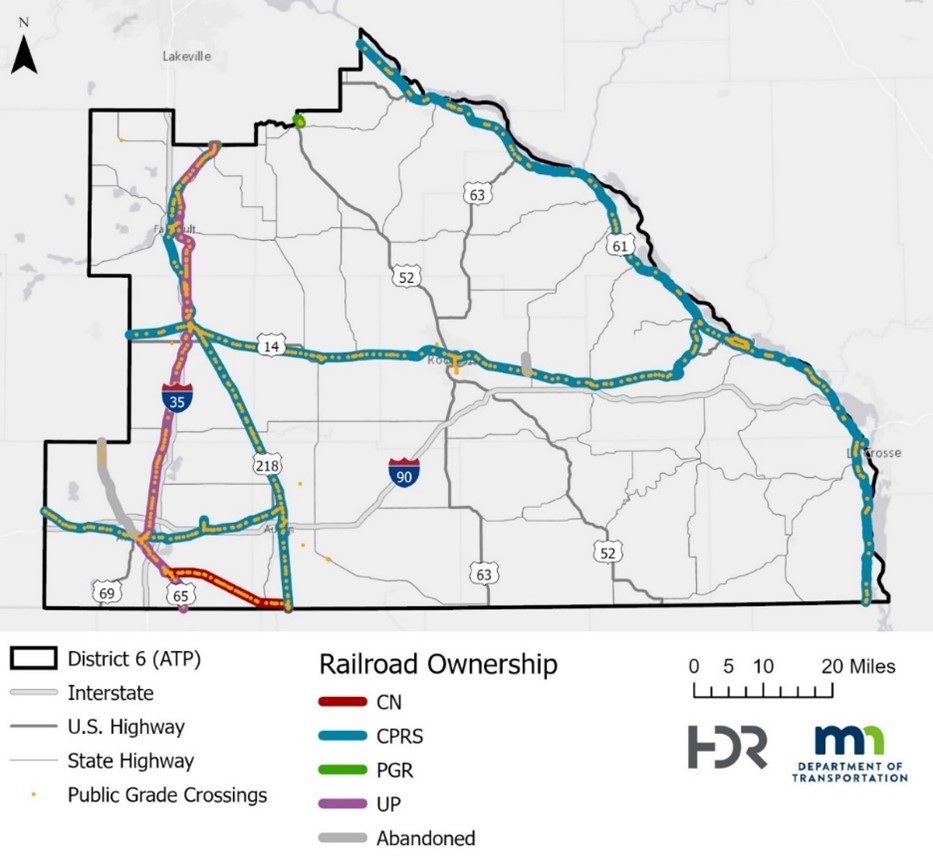
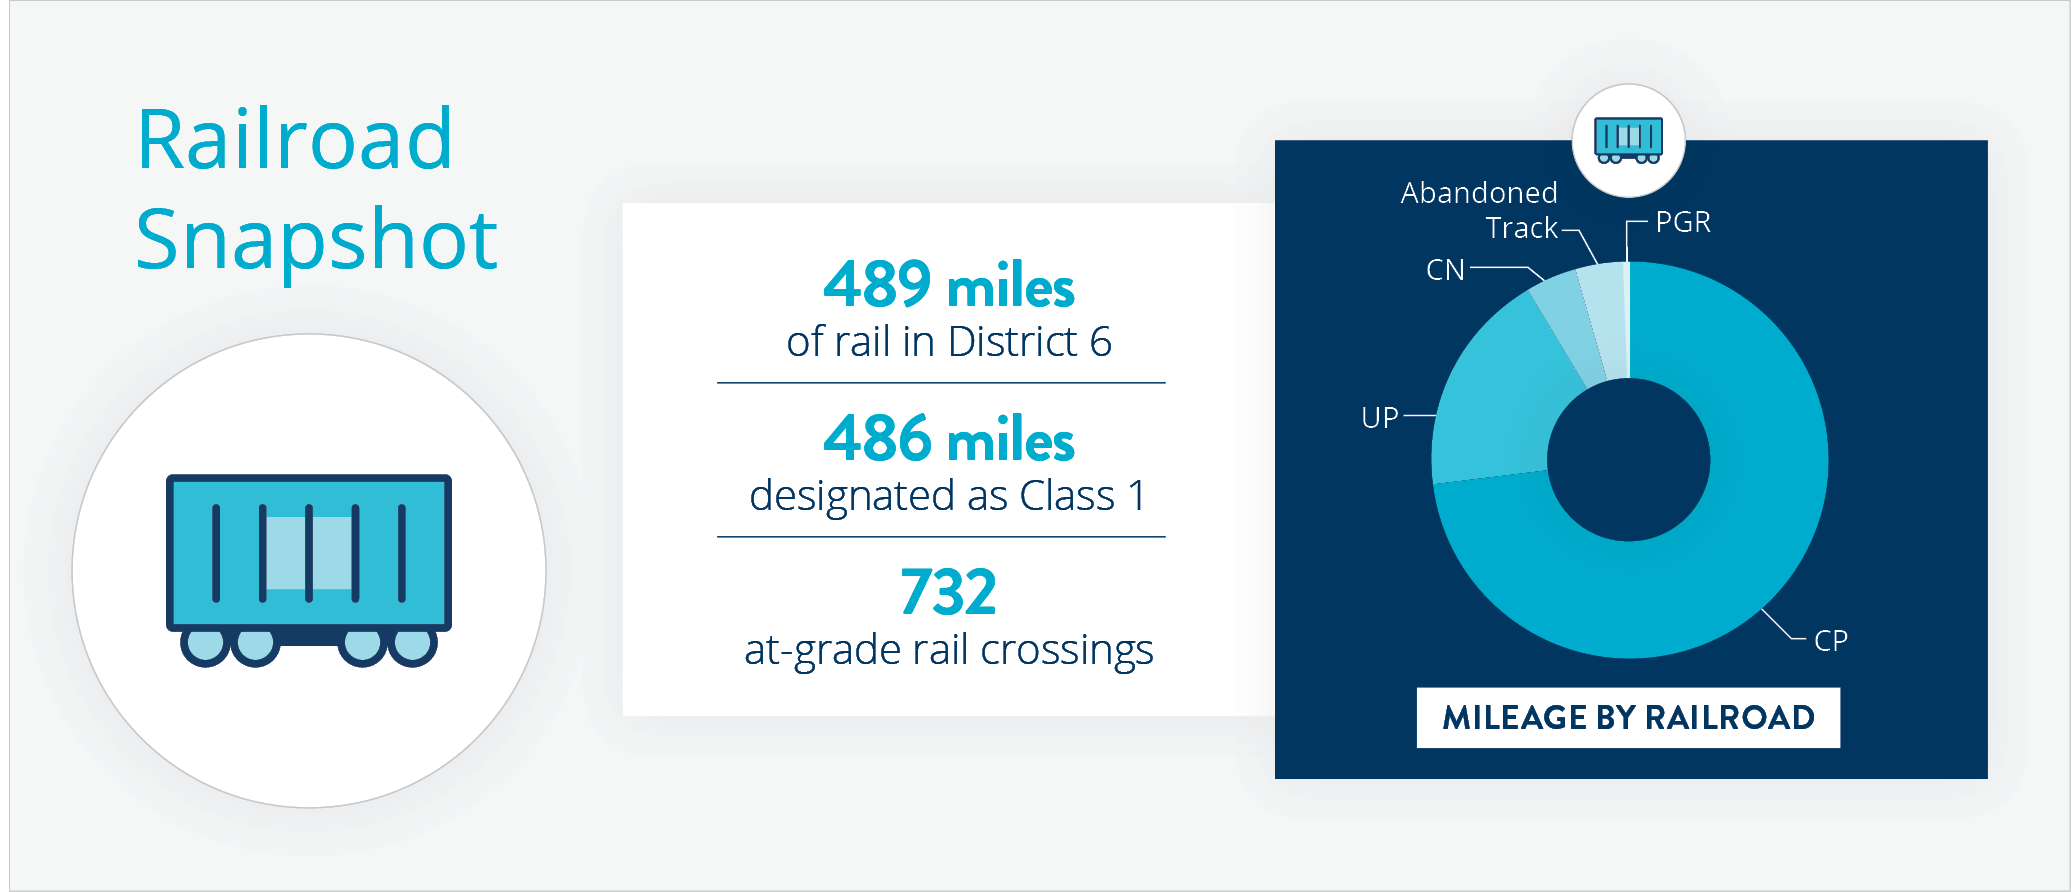
Railroad Snapshot
Rail Transport Analysis
Rail plays a critical role in District 6's freight system, connecting ports on the Mississippi River with major industrial centers around the state. There are nearly 500 miles of rail line in the District and over 700 highway-rail grade crossings. Canadian Pacific Railway (CP) makes up the largest share of both track miles and grade crossings.
Click the image above to enlarge.
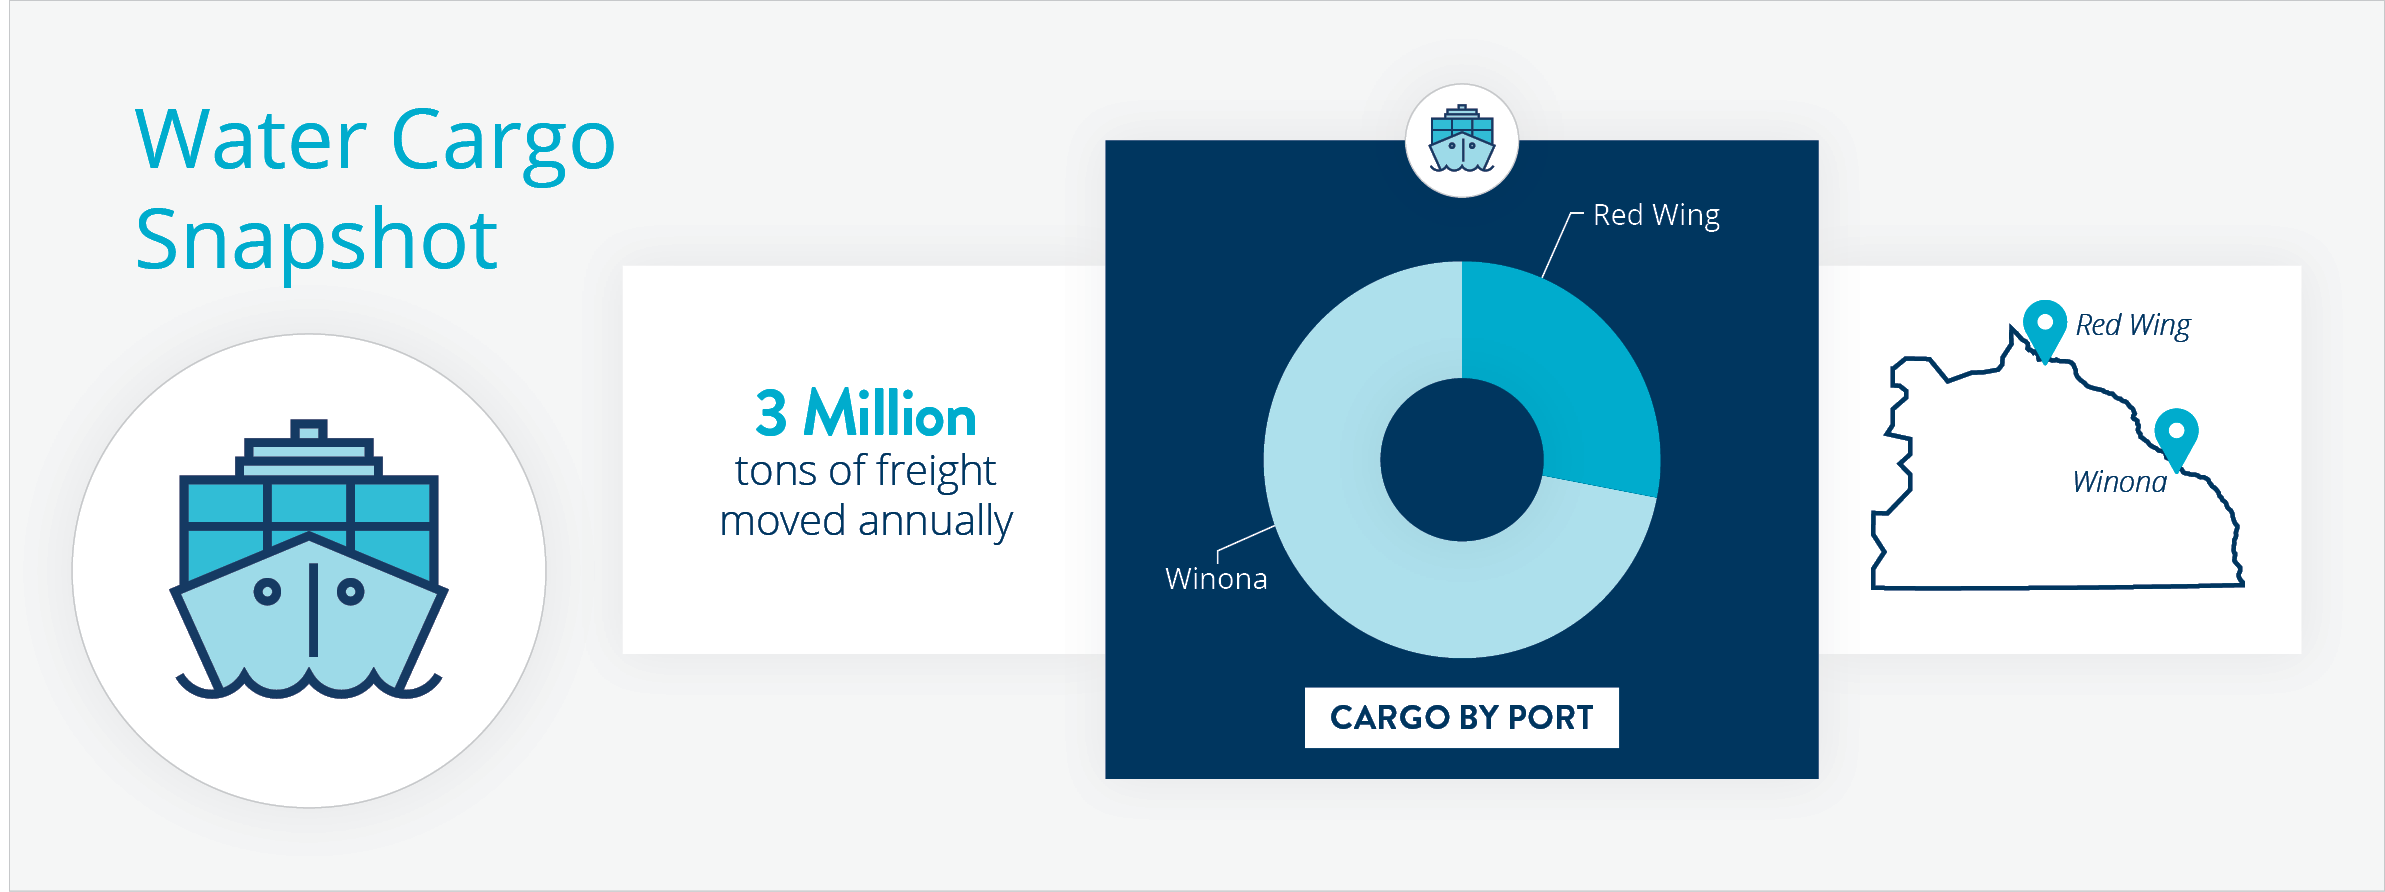
Water Cargo Snapshot
Waterway Transport Analysis
Water cargo is a uniquely important freight feature for District 6 with the Mississippi River comprising the eastern border of the District. There are two major ports located in District 6 on the Mississippi River at Red Wing and Winona Commercial Harbors. The water cargo system along this stretch of the Mississippi River consists of 15 individual freight-handling docks and 7 lock chambers. Of these dock locations, three are located across the river in Wisconsin at Genoa, La Crosse, and Alma. The Mississippi River at this location is designated as Marine Highway M-35. There are 4 intermodal terminals around the port of Winona that provide key connections between water cargo and the CP rail line that runs adjacent to the Mississippi River along US 61.
Water cargo movements are highly concentrated around the ports at Red Wing and Winona. In 2019, more than 600,000 tons of freight were moved through the Red Wing port. Approximately 82 percent of this freight was in the outbound direction. In 2019, more than 1.5 Million tons of freight was through the Winona port. Approximately 58 percent of this freight was in the outbound direction. Water cargo movement is a highly seasonal activity with most of the activity occurring between July and November.
Click the image above to enlarge.
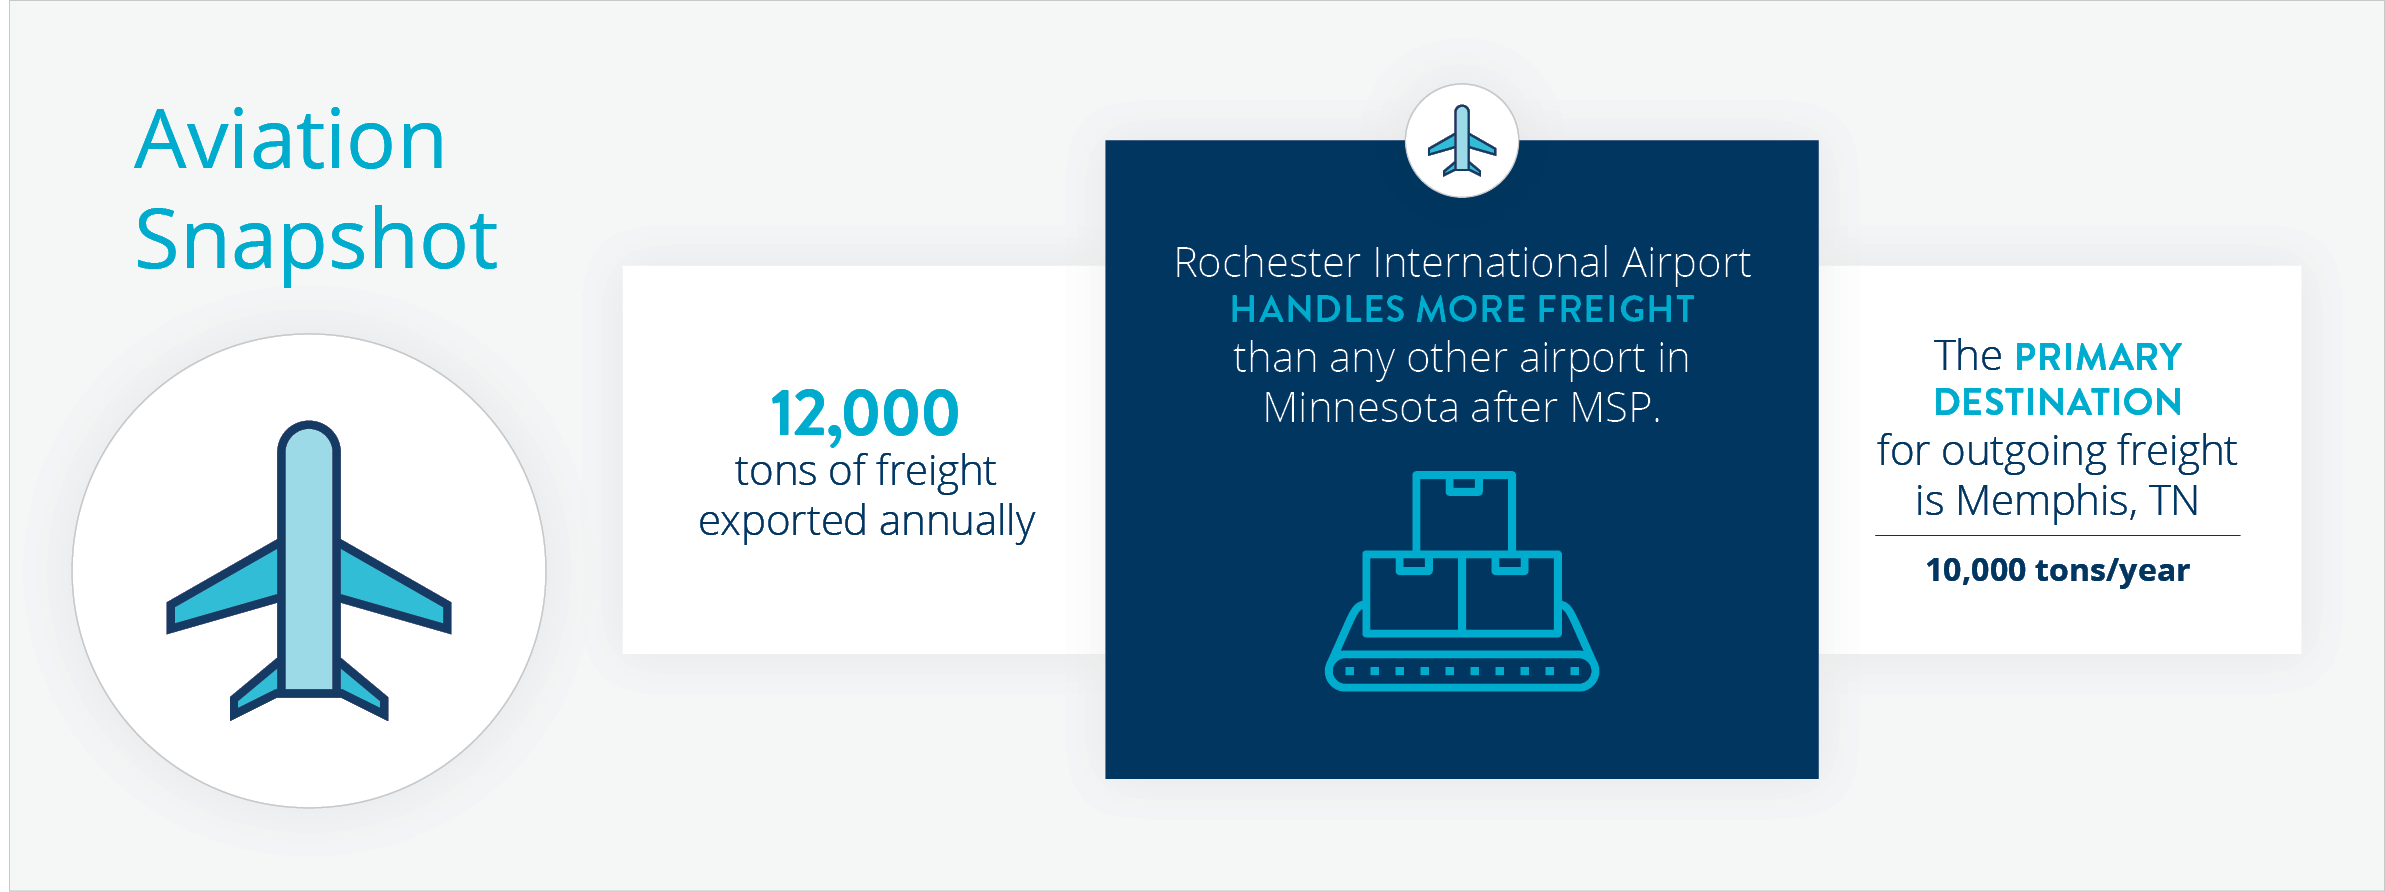
Aviation Snapshot
Air Transport Analysis
Air cargo is used primarily for high-value, low-tonnage commodities such as electronics and other equipment and is a critical component of many just-in-time delivery supply chains where fast and reliable delivery speed is important.
- Three airports in District 6 currently handle freight or have handled freight in the previous five years. These include the Rochester International Airport, Houston County Airport, and Winona Municipal Airport. Of the three, Rochester makes up most freight shipments handled, with a monthly average of approximately 2 million pounds handled in 2019, amounting to nearly 12,000 tons per year.
- The key origin and destination for air cargo is Memphis (10,000 tons per year), with FedEx shipments making up most of those trips. Other connecting cities include Indianapolis (FedEx Hub), Minneapolis-St. Paul, and Fort Wayne (a medical device center).
- Nearly all the District's air cargo freight and passenger service is handled at the Rochester International Airport. A small amount of mail service is provided by the Houston County Airport. Relative to the other airports, the Winona Municipal Airport handles very small volumes of freight, mail, and passengers.
Click the image above to enlarge.
Key Findings
The results from the Freight Profile highlight the importance of infrastructure to the economy and related businesses operating in southeastern Minnesota. Key takeaways from our analysis:
- 37 percent of District 6 jobs are in freight-related industries.
- Specialized industries in the District include Scientific Research and Development Services, Grain and Oilseed Milling, and Farm Product Material Wholesalers.
- Albert Lea has the highest concentration of truck parking activity and capacity in the state. Truck parking needs are greatest in the area between Faribault and Northfield.
- Water cargo is an important mode, particularly for grain and oilseed shipments at ports in Red Wing and Winona.
- Winona is a hotspot for highway-rail grade crossing crashes with four fatal crashes in five years.
- Air cargo out of the Rochester airport supports shipments of high value goods like electronic components and precision instruments.
Prioritization
The identification of freight needs in the region relies on a variety of sources including the work completed and summarized in our Working Papers, interviews with freight area businesses, coordination with the Project Advisory Committee and public engagement. The intended purpose of this approach is to combine our data with more qualitative methods (interviews and survey) to develop a comprehensive list of freight needs and issues within the region.
Freight need categories
The list of freight needs identified during the data analysis and stakeholder outreach was categorized into three categories.
- Safety:
- Safeguard Minnesotans
- Mobility:
- Improve Minnesota's mobility
- Condition:
- Preserve Minnesota's infrastructure
By comparing needs and programmed projects, this analysis identifies areas where freight needs are not currently being addressed. The map below overlays the locations of all identified freight needs with the locations of programmed transportation improvements.
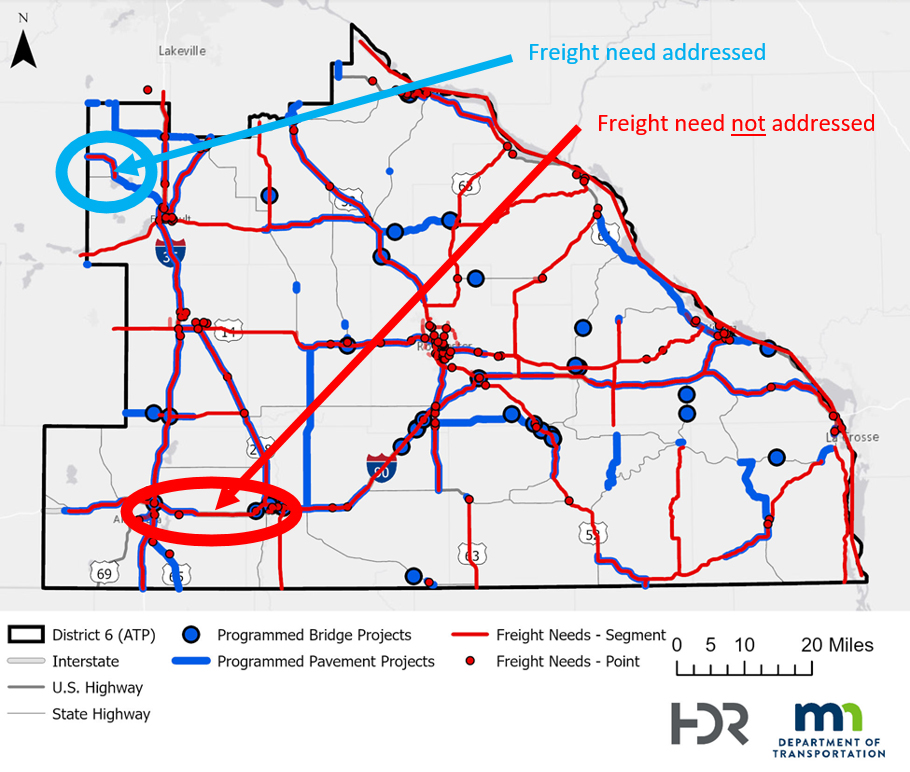
Click the image above to enlarge.
Where We Ended Up
Using the information outlined on the last slide, the 50 top ranked locations were reviewed to assess whether they should be considered for conceptual analysis and cost estimation. A total of 12 issues were selected from this list. Explore the map below to see selected locations for additional analysis.
Explore the map below to see selected locations for additional analysis.
Map Legend
| Pin | Issue ID | Issue Type | Proposed Concept(s) |
|---|---|---|---|
 |
D46 | Safety - Intersection | Left turn lanes; Roundabout |
 |
D54 | Safety - Intersection | Roundabouts |
 |
D64 | Safety - Intersection | Advance signing/access modifiation |
 |
D65 | Safety - Intersection | Geometric improvements |
 |
D98 | Safety - Segment | Lengthen acceleration lanes; Additional weaving lanes |
 |
D108 | Safety - Segment | Lengthen acceleration lane |
 |
D110 | Safety - Segment | Revise lane striping |
 |
D112 | Safety - Segment | Access modification/frontage roads |
 |
D113 | Safety - Segment | Access modification/frontage roads |
 |
D257 | Mobility - Truck Travel Time Reliability | Access modification/frontage roads |
 |
S49 | Stakeholder Issue | Conversion to all-way stop |
 |
S59 | Stakeholder Issue | SB left turn lane |
Stay Connected
Share this information
Please pass along the link to this virtual open house to family, friends and coworkers who live or work in the area.
Submit a comment
To submit a general comment or question for the project team, click on the comment button in the top right corner of your screen.
Follow the plan
For more information about the project, please visit: www.dot.state.mn.us/ofrw/freight/districtfreightplan/d6.html
Contact MnDOT
Heather Lukes, MnDOT District 6 Planning Director
heather.lukes@state.mn.us | 507-286-7552
Kurt Wayne, MnDOT District 6 Planner
kurt.wayne@state.mn.us | 507-259-8074