TVA Integrated Resource Plan

 Power on
2019 Integrated Resource Plan
The Tennessee Valley Authority’s 2019 IRP is a long-term plan that provides direction on how TVA can best meet future demand for power.
It shapes how TVA will provide low-cost, reliable and clean electricity; support environmental stewardship; and foster economic development in the Tennessee Valley for the next 20 years.
The plan is a crucial element for TVA’s success in a constantly changing business and regulatory environment, and it will better equip TVA to meet many of the challenges facing the electric utility industry in the coming years to benefit the Valley.
The IRP will enhance TVA’s ability to create a more flexible power-generation system that can successfully integrate increasing amounts of renewable energy sources and distributed energy resources (DER) while ensuring reliability.
The IRP also will inform TVA’s next Long-Range Financial Plan.
TVA’s 2019 IRP Recommendation
Study Results
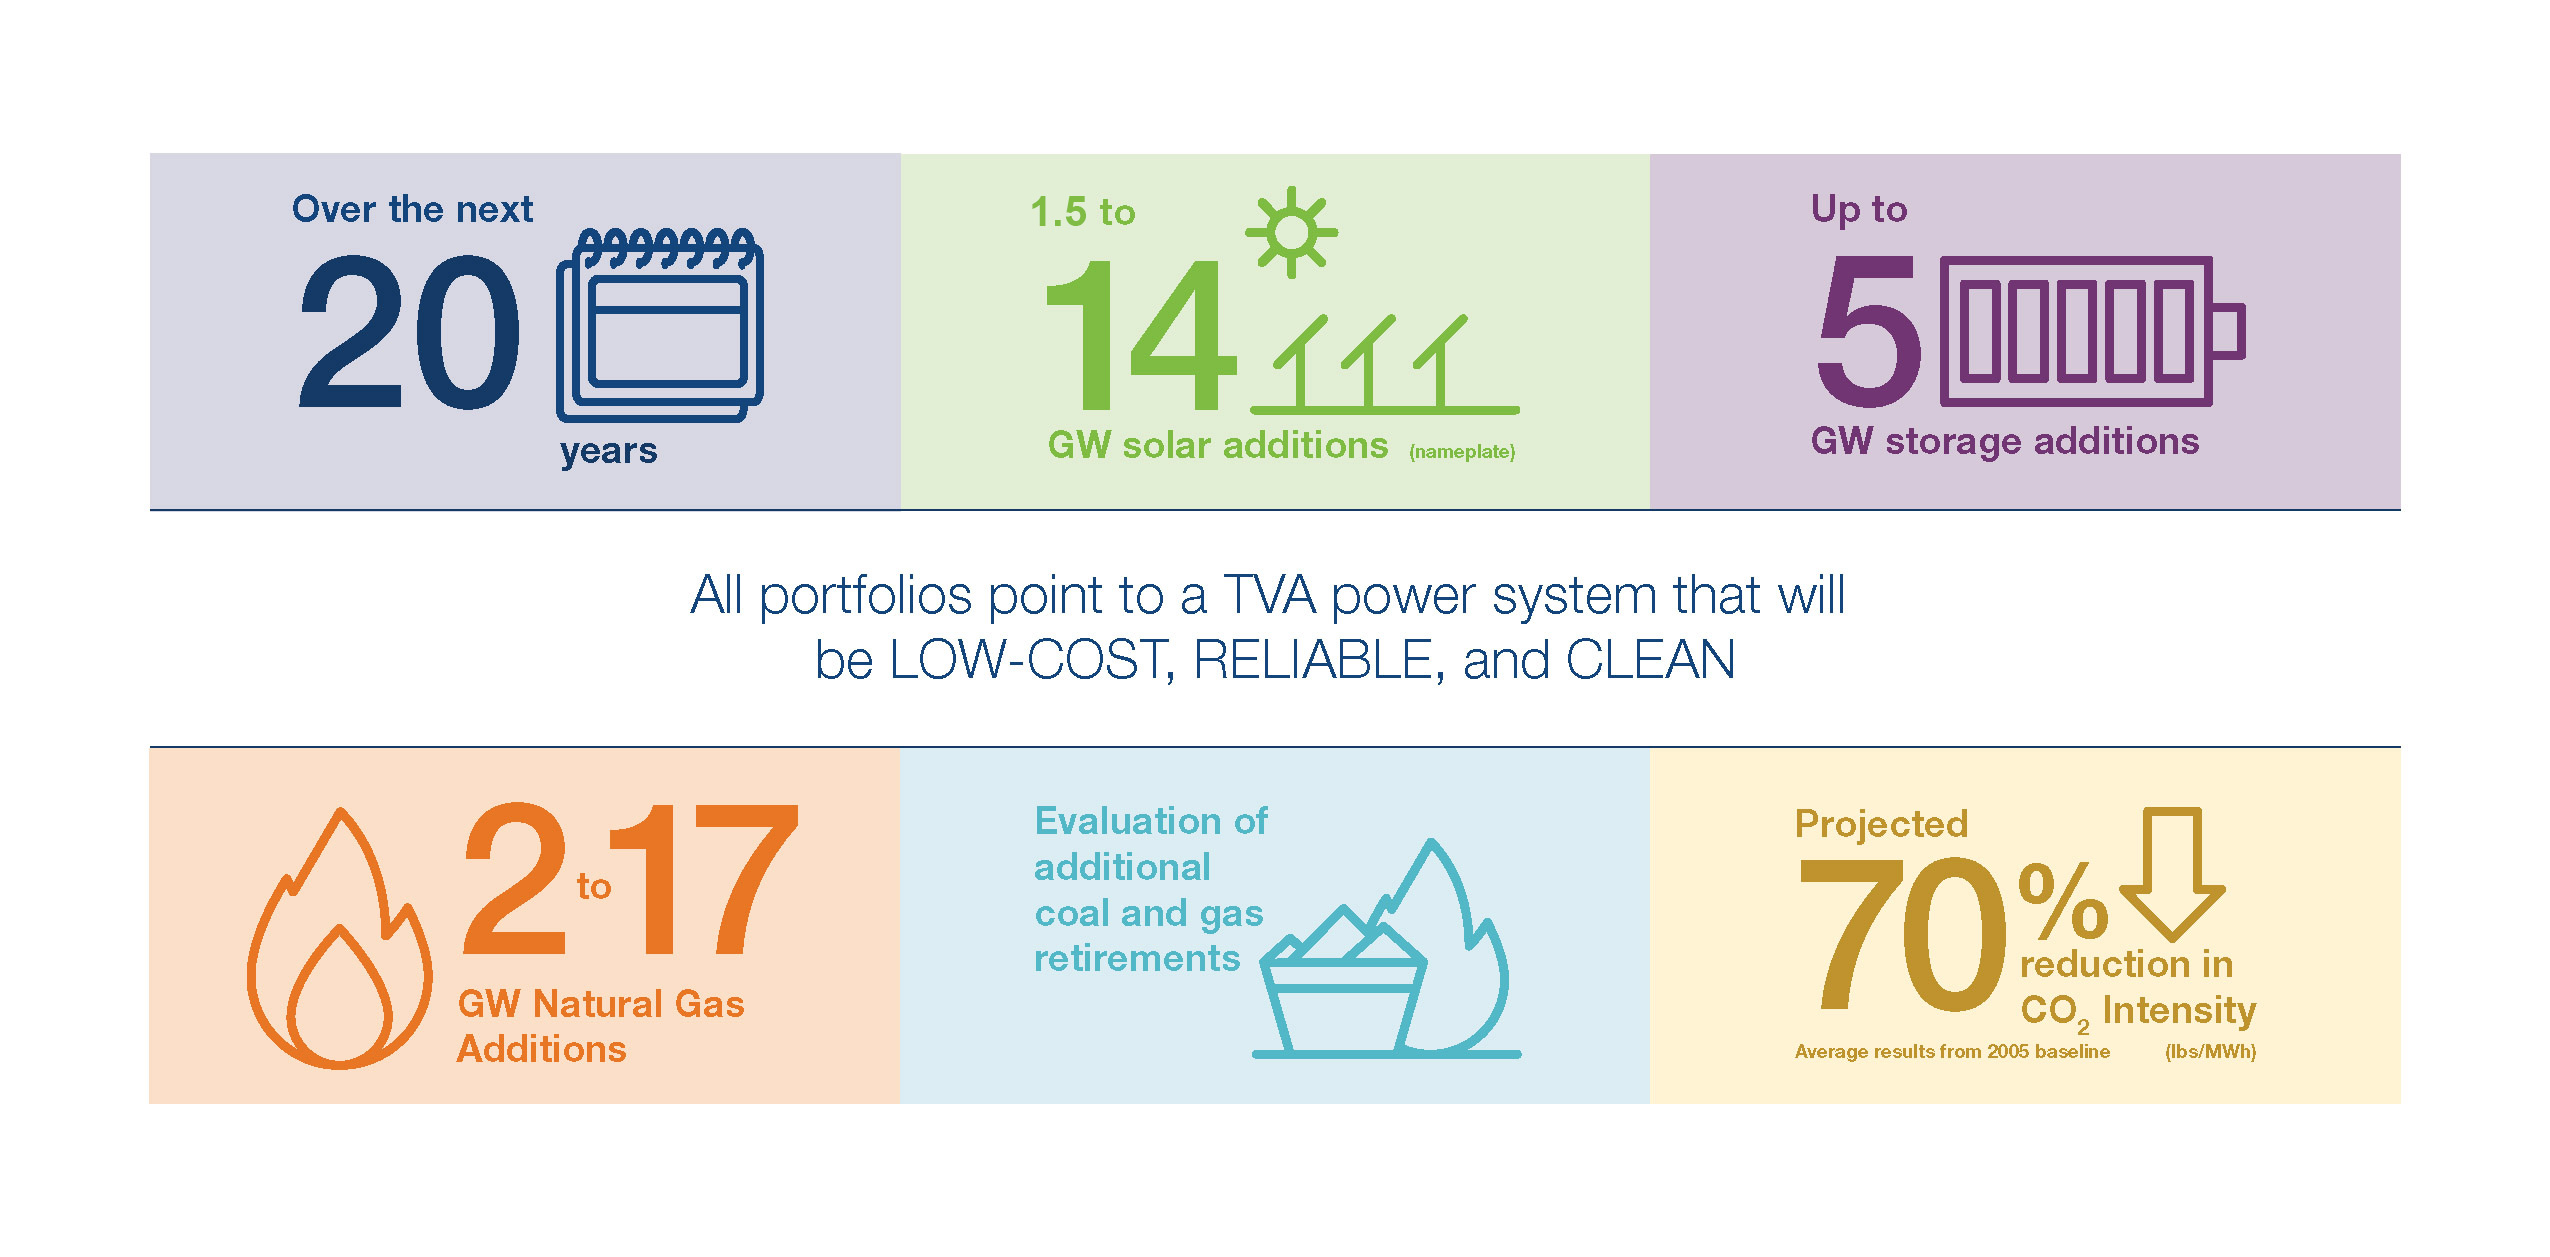
During the IRP process, TVA — with significant input from stakeholders and the public — considered a wide range of future scenarios, various business strategies and a diverse mix of power-generation resources to build on TVA’s existing asset portfolio. IRP study results show:
- There is a need for new capacity in all scenarios to replace expiring or retiring capacity.
- Solar expansion plays a substantial role in all futures.
- Gas, storage and demand response additions provide reliability and/or flexibility.
- No baseload resources (designed to operate around the clock) are added, highlighting the need for operational flexibility in the resource portfolio.
- Additional coal retirements occur in certain futures.
- Energy efficiency (EE) levels depend on market depth and cost-competitiveness. • Wind could play a role if it becomes cost-competitive.
- In all cases, TVA will continue to provide for economic growth in the Tennessee Valley.
Observations
TVA has observed that the scenario, or future environment, it finds itself operating in will have more impact on overall results than the strategy or strategies it implements. TVA also recognizes that all strategies have positive aspects but also have unique tradeoffs to consider.
If TVA needs to shift its resource mix, that need will be driven by these key variables: changing market conditions, more stringent regulations and technology advancements. Recognizing that a variety of future scenarios are possible and each strategy has positive aspects, all IRP results are included in the IRP Recommendation to allow TVA decision-makers flexibility to respond as the future evolves.
Range of MW Additions and Subtractions by 2028 and 2038
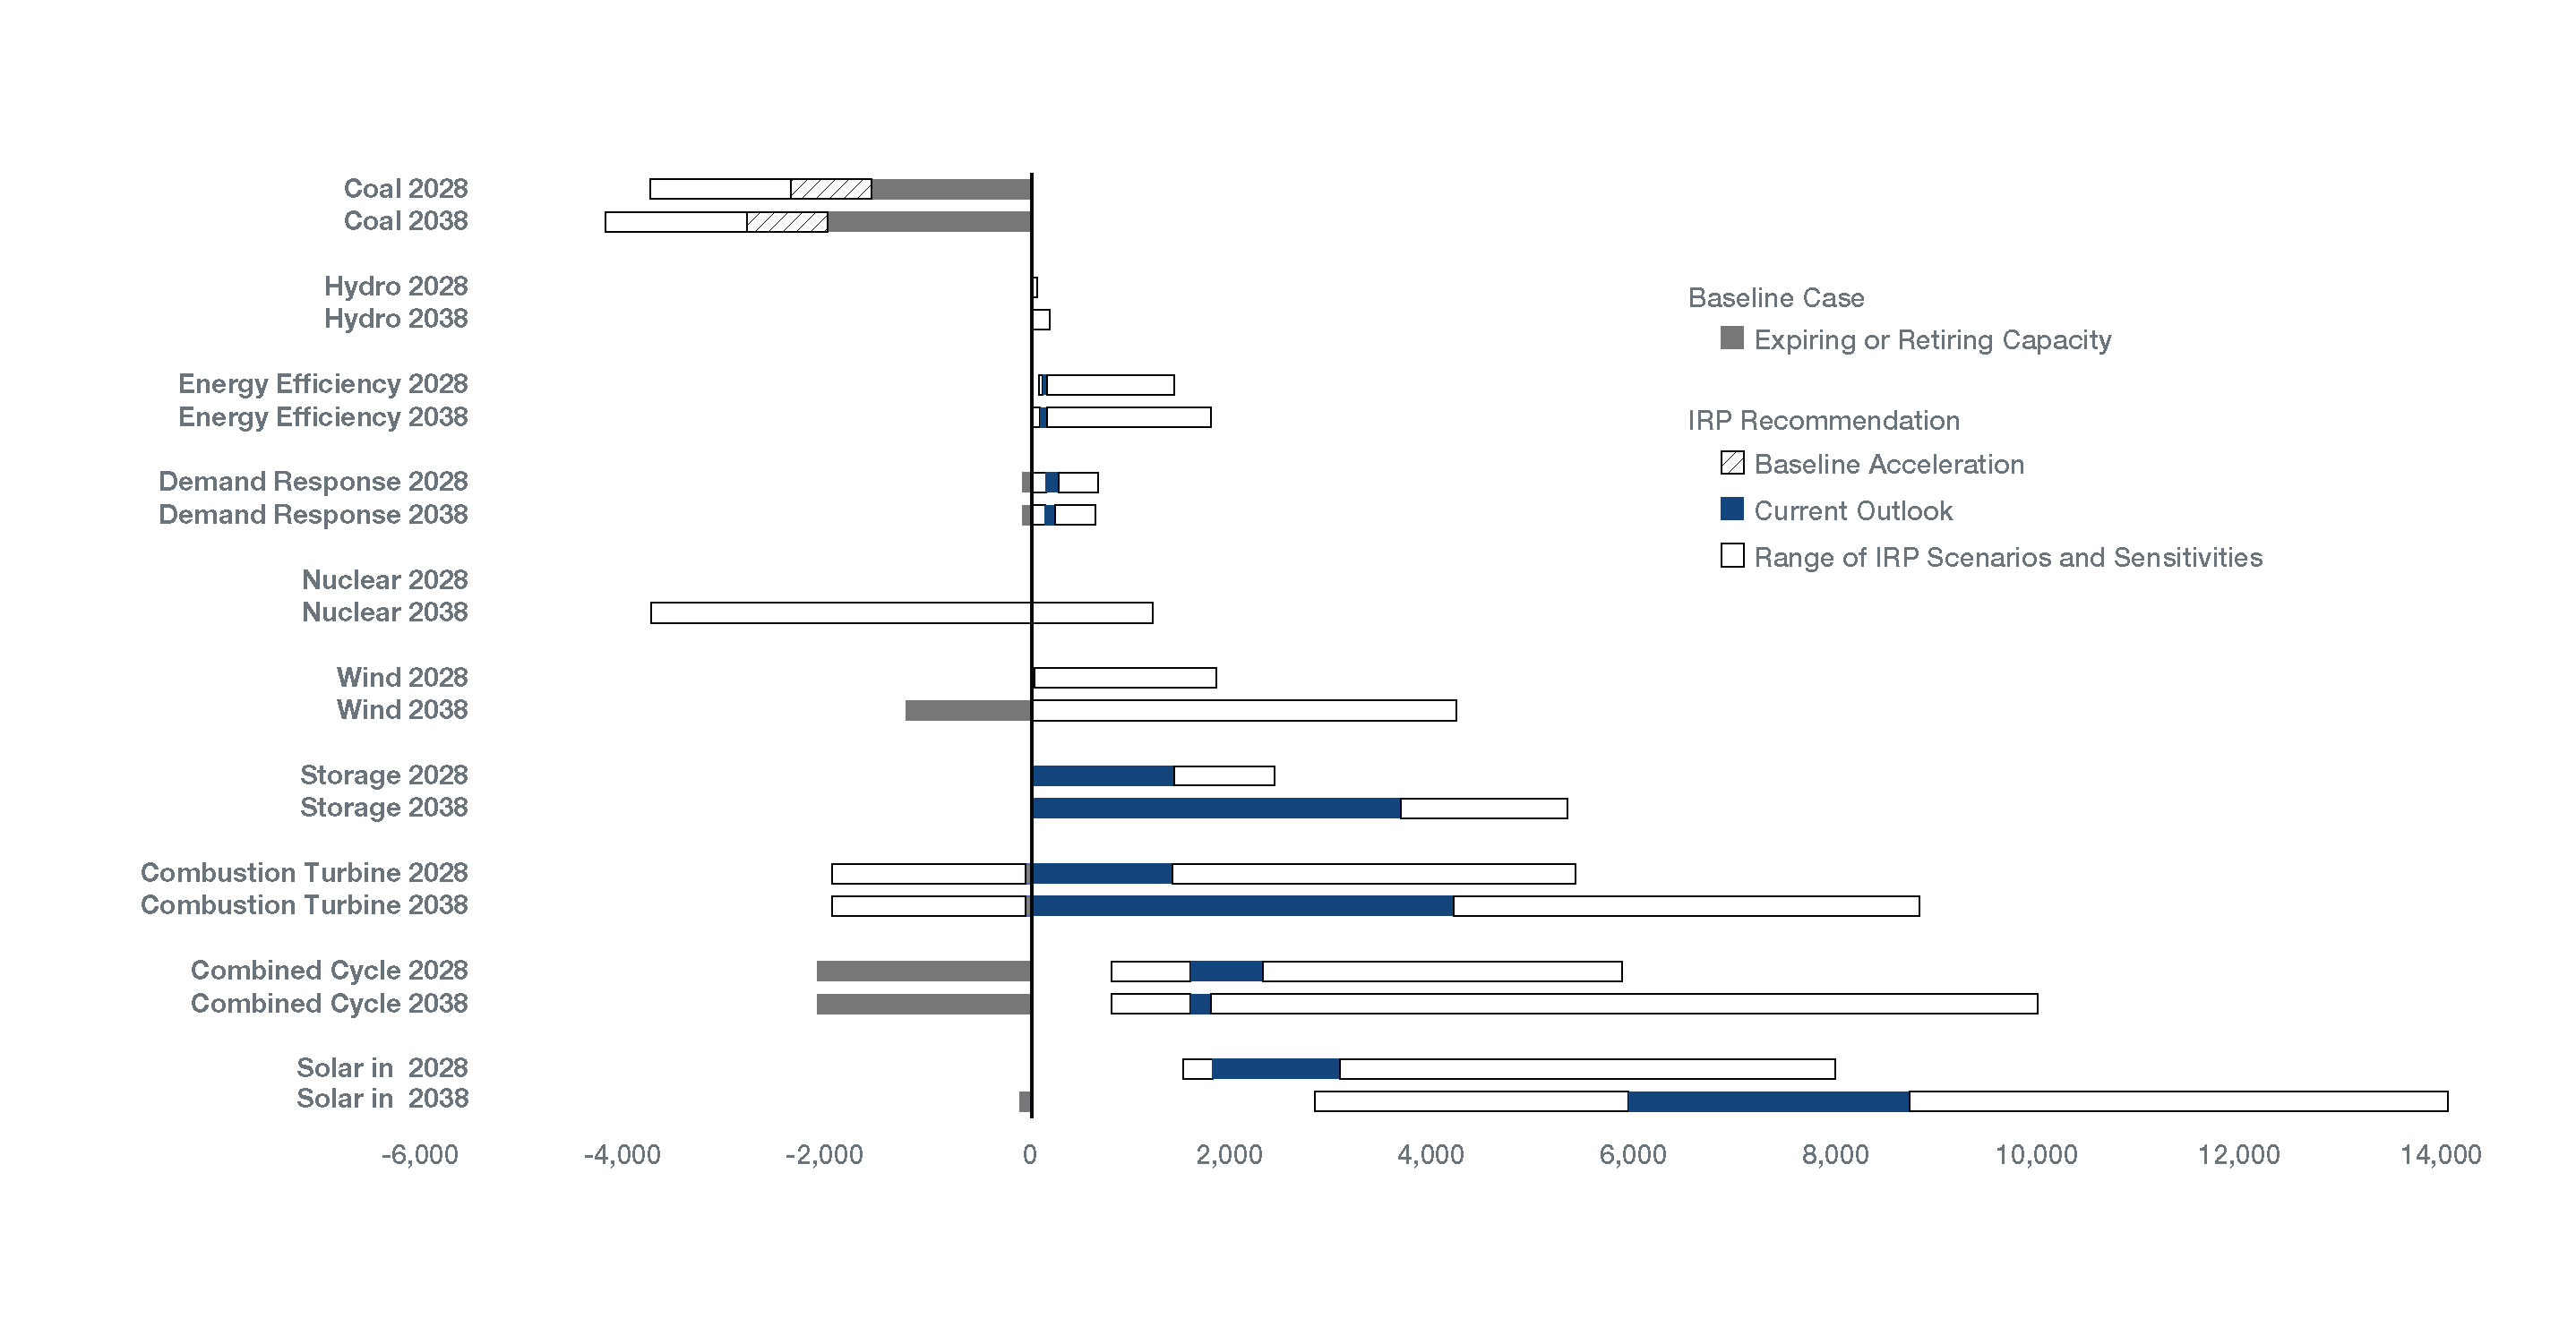
A diverse, flexible portfolio
TVA’s recommended planning direction affirms its commitment to a diverse and flexible resource portfolio guided by the least-cost system planning mandate.
The ranges shown, stated in megawatts (MW) of capacity, provide a general guideline for resource selections. In developing a Recommendation from the study, TVA elected to establish guideline ranges for key resource types (owned or contracted) that make up the target power supply mix.
This general planning direction is expressed over the 20-year study period while also including more specific direction over the first 10-year period. Meeting the Valley’s future needs in accordance with the resource technologies and ranges in this Recommendation will position TVA to continue to deliver low-cost, reliable and clean power to the people of the Tennessee Valley.
The IRP Recommendation meets the dual objective of ensuring flexibility to respond to the future while providing guidance on how our resource portfolio should change as the future unfolds.
Implementation
With the implementation of the IRP Recommendation will come certain challenges. For example, the IRP Recommendation includes significant renewables expansion, which means it will become increasingly important to know the location of renewable resources, both utility and distributed scale, and how weather impacts solar generation. Early experience with battery storage on the system would provide additional insight to how the various storage-use cases might be employed to provide economic benefit and system flexibility, especially with increasing penetration of renewables.
TVA will need to partner with local power companies and other stakeholders in the region to better understand the potential for distributed resources in the Valley and their locational value to inform resource decisions. Finally, the IRP Recommendation also includes more conventional resources, primarily gas-fired, and TVA will need to consider the implementation challenges in the areas of siting and permitting, both for the units themselves and associated transmission lines and gas pipelines.
In the process of developing the IRP, stakeholders raised a number of policy-related issues that are outside the scope of the IRP itself but will need to be considered as TVA moves toward implementation of recommendations from the IRP study. These considerations include continued evolution of programs that provide flexibility for customer-owned generation, evolution of federal/state energy and environmental policies, advancements in customer expectations and requirements for clean energy, and enhancing low-income equity and energy/environmental justice.
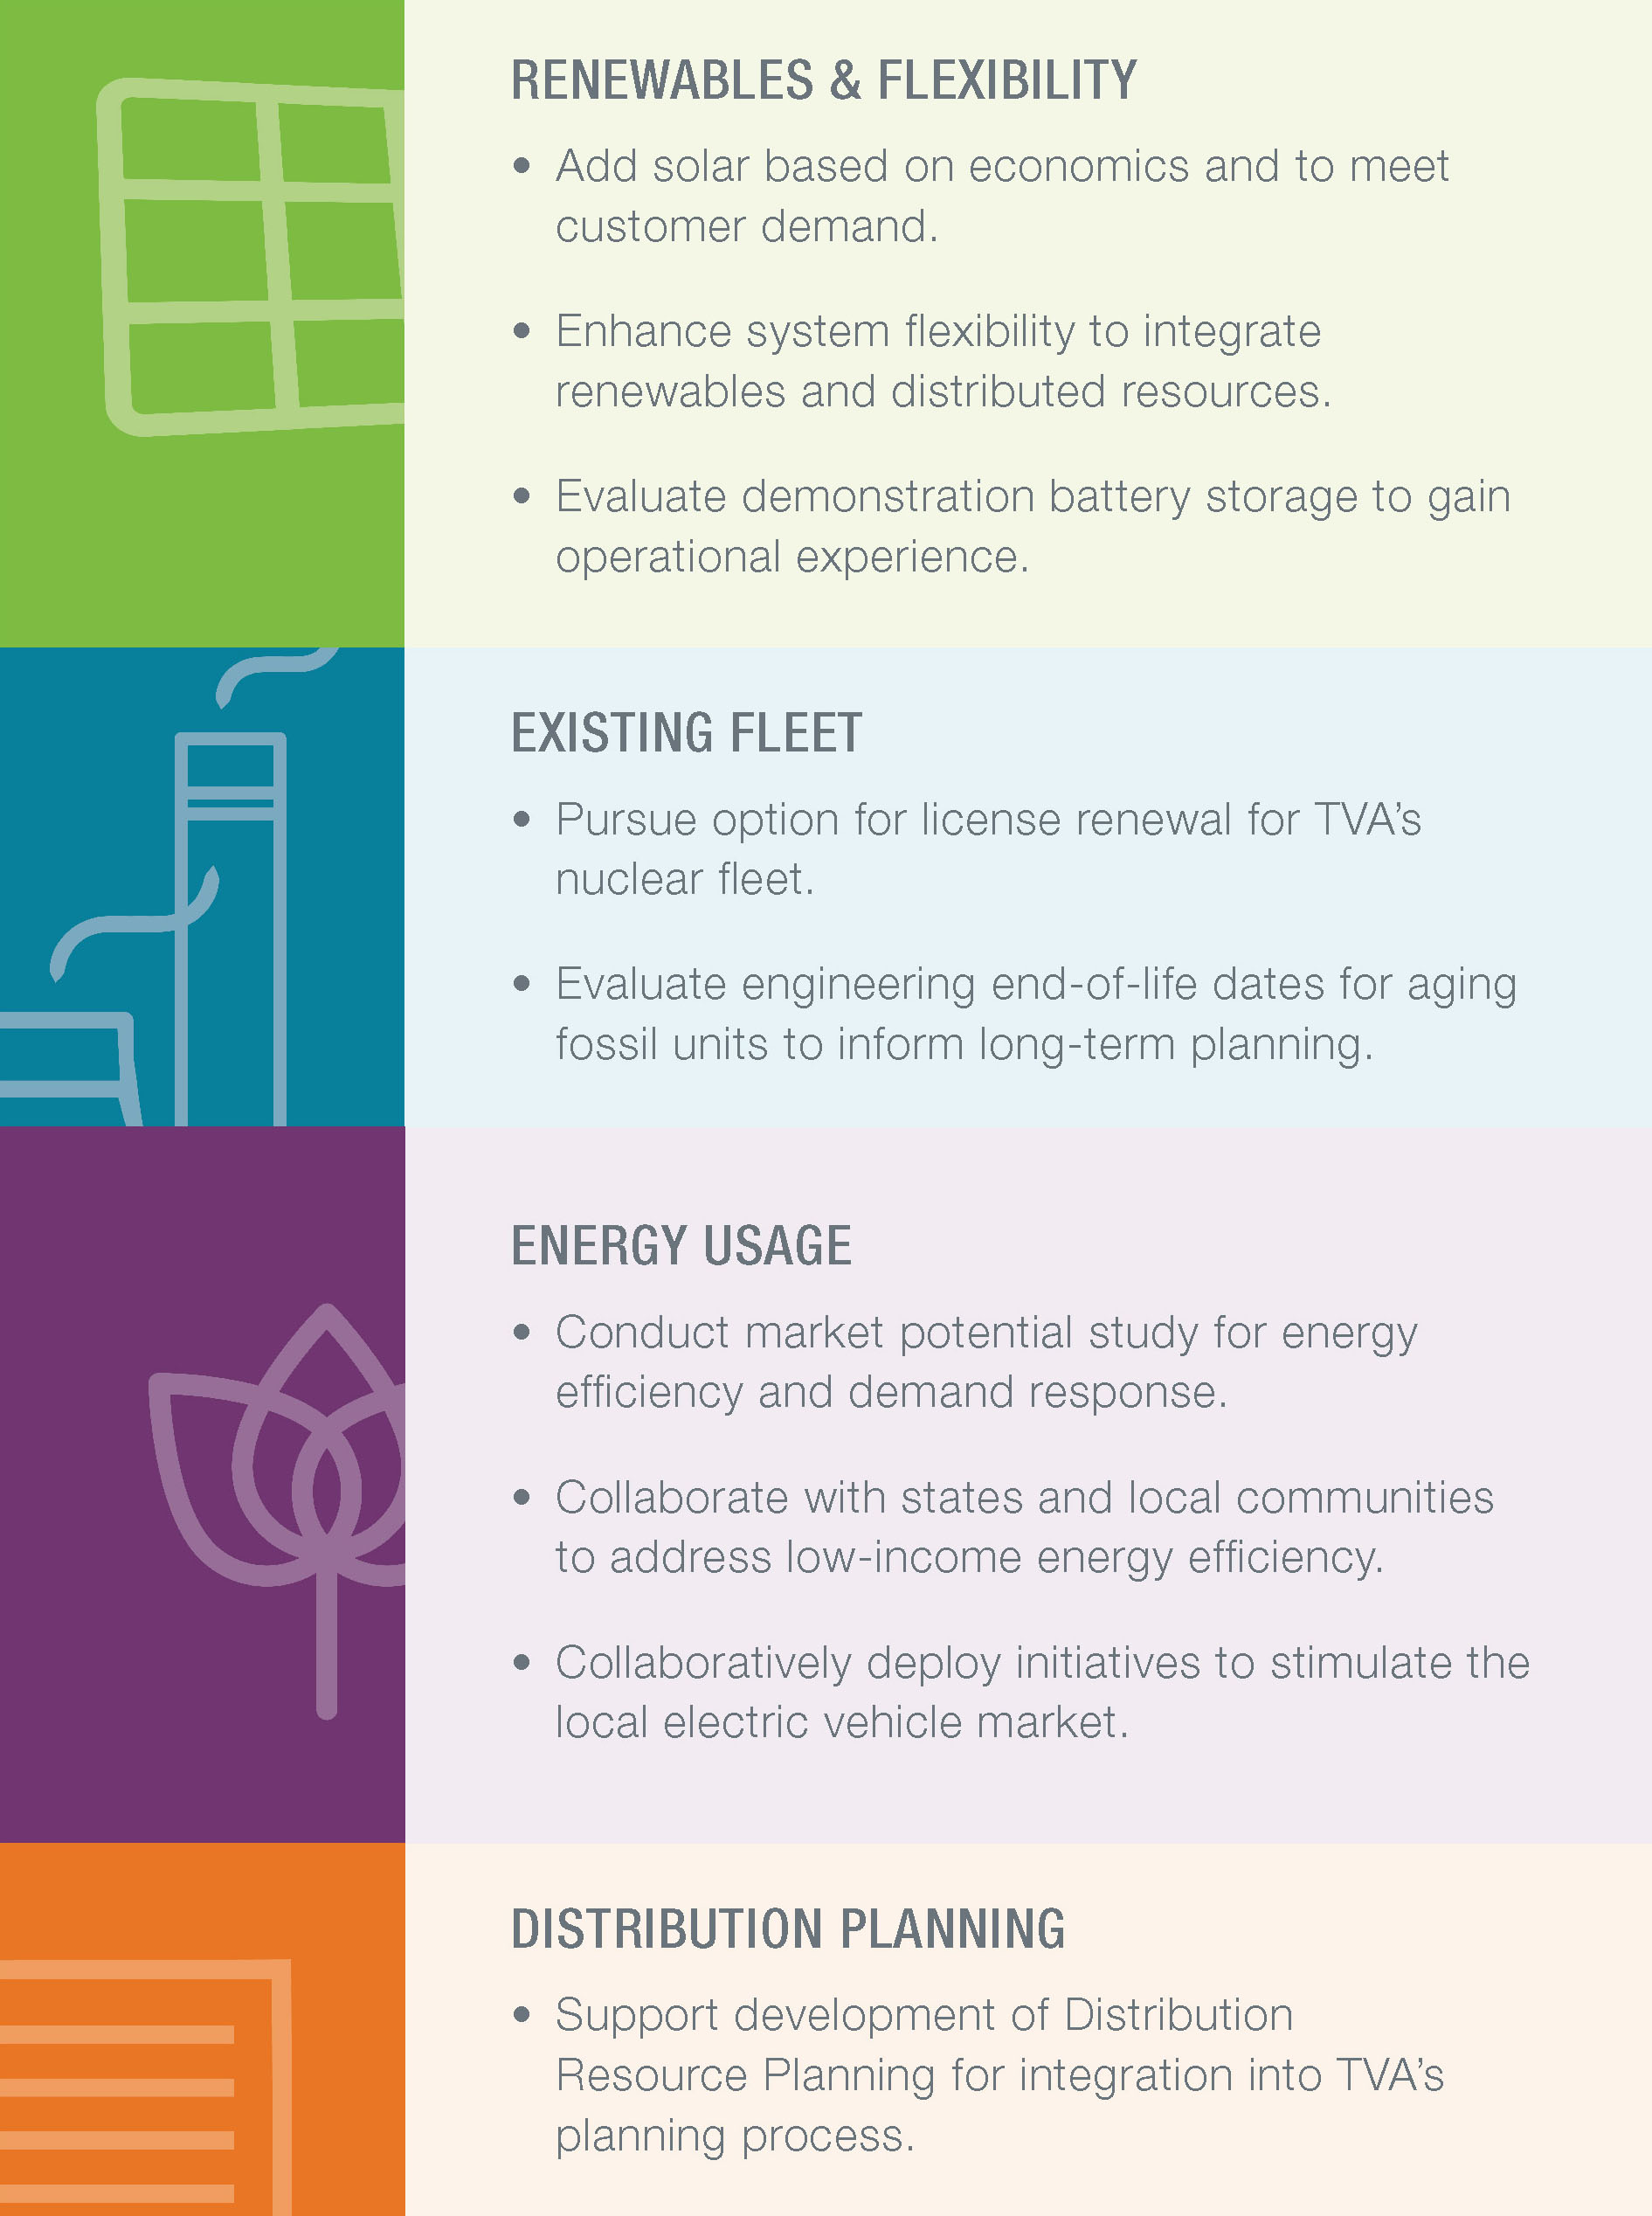
Near-Term Actions
The scenarios and strategies evaluated in the IRP provide insights to how TVA’s resource portfolio may need to evolve as the future becomes clearer. The results indicate there are near-term actions that would provide benefit across multiple futures. The actions include:
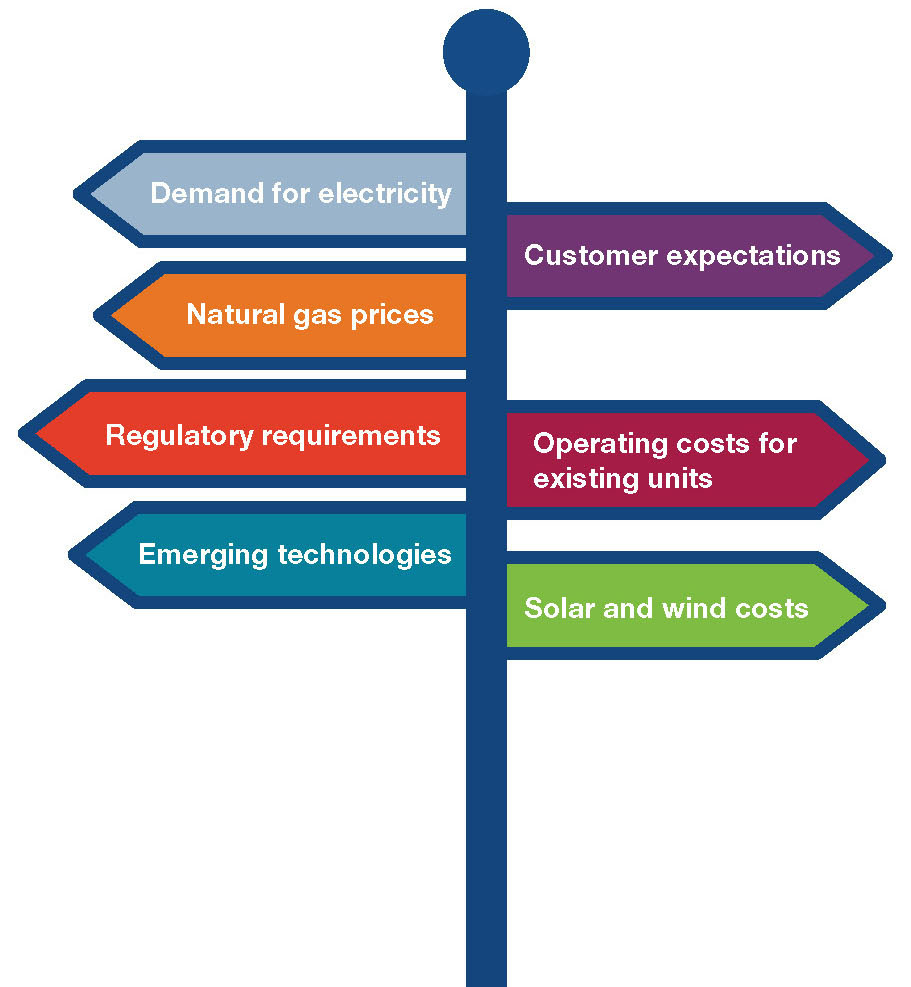
Key Signposts
As the future unfolds, TVA will monitor key signposts that will guide decisions in the longer term. The signposts relate to key variables that could have a significant influence on the future generation portfolio. These key signposts are shown to the right (or below on a mobile device).
TVA will closely monitor these key drivers related to changing market conditions, more stringent regulations, and technology advancements to inform appropriate actions within the recommended ranges and appropriate timing for initiating the next IRP.
What is an Integrated Resource Plan?
When it comes to your electricity, what is important to you - That it’s reliable? Low-cost? Environmentally sustainable?
Learn more about the IRP!
Purpose and Need
The 2019 IRP is a comprehensive study that provides direction on how TVA can best deliver clean, reliable and affordable energy in the Valley over the next 20 years.
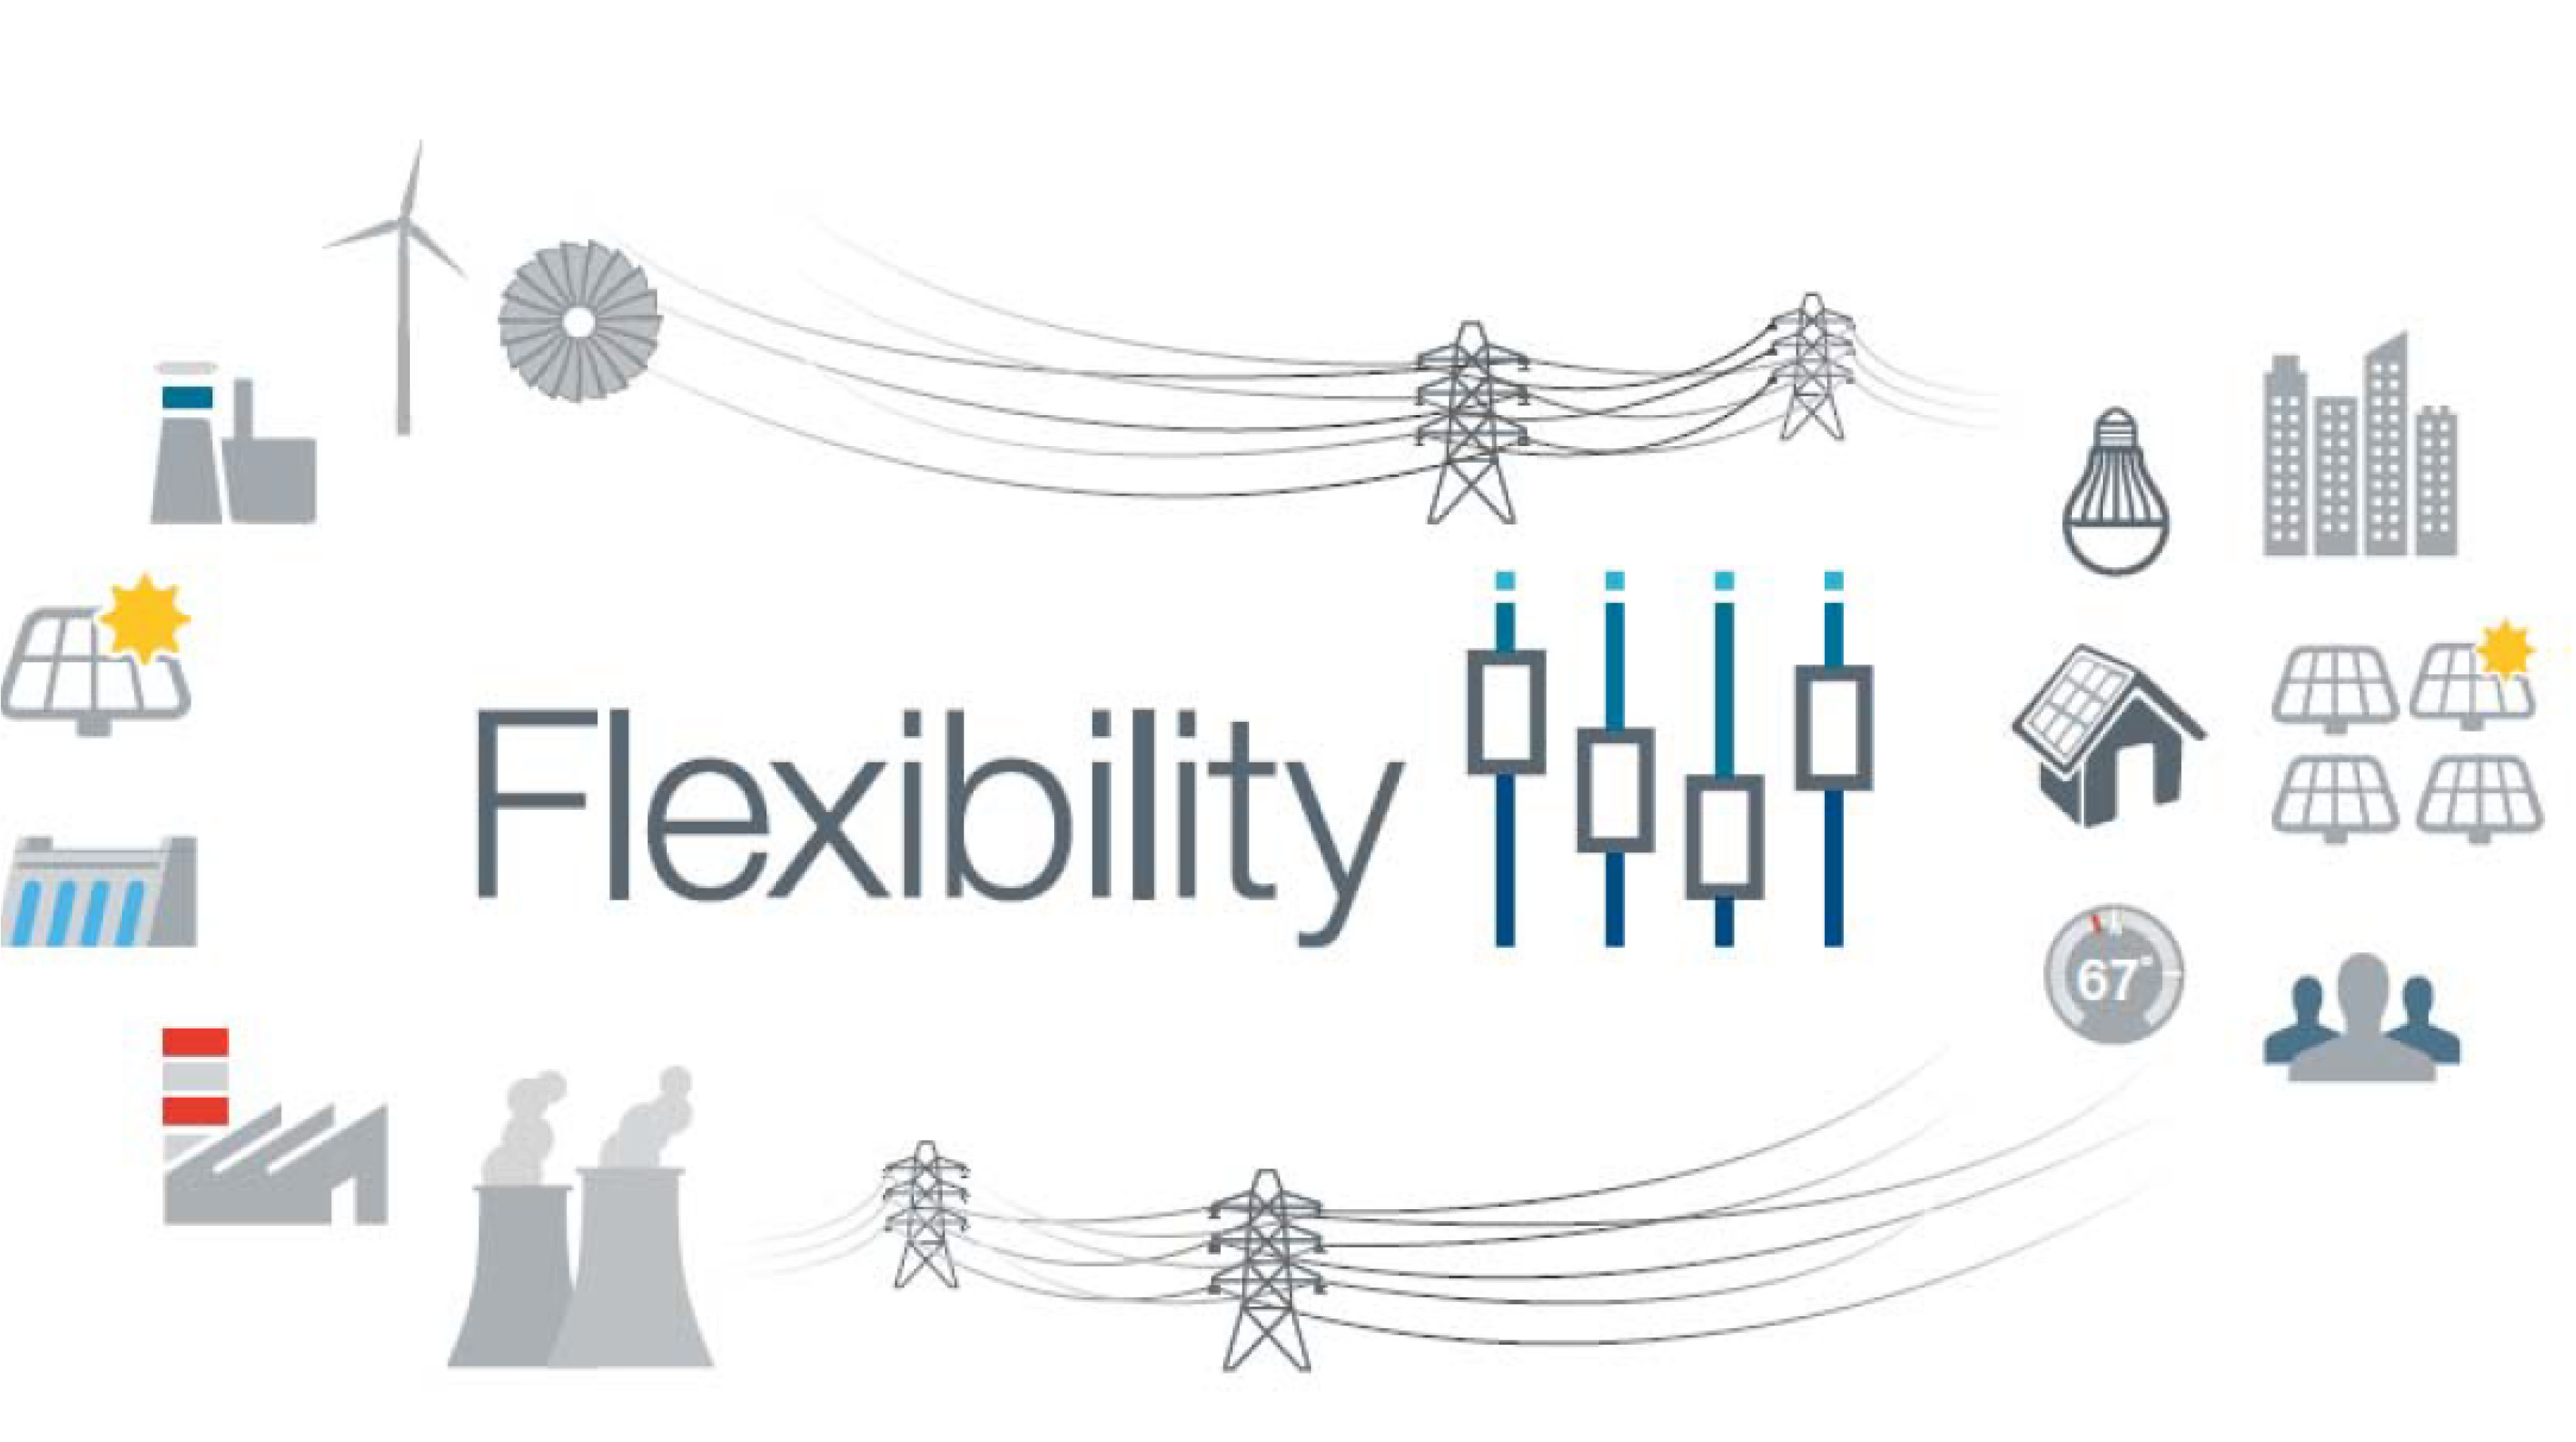
A Focus on Flexibility
The IRP guides TVA in making decisions about energy resources used to meet future demand. The 2019 IRP emphasizes the importance of flexibility in response to the changing energy marketplace.
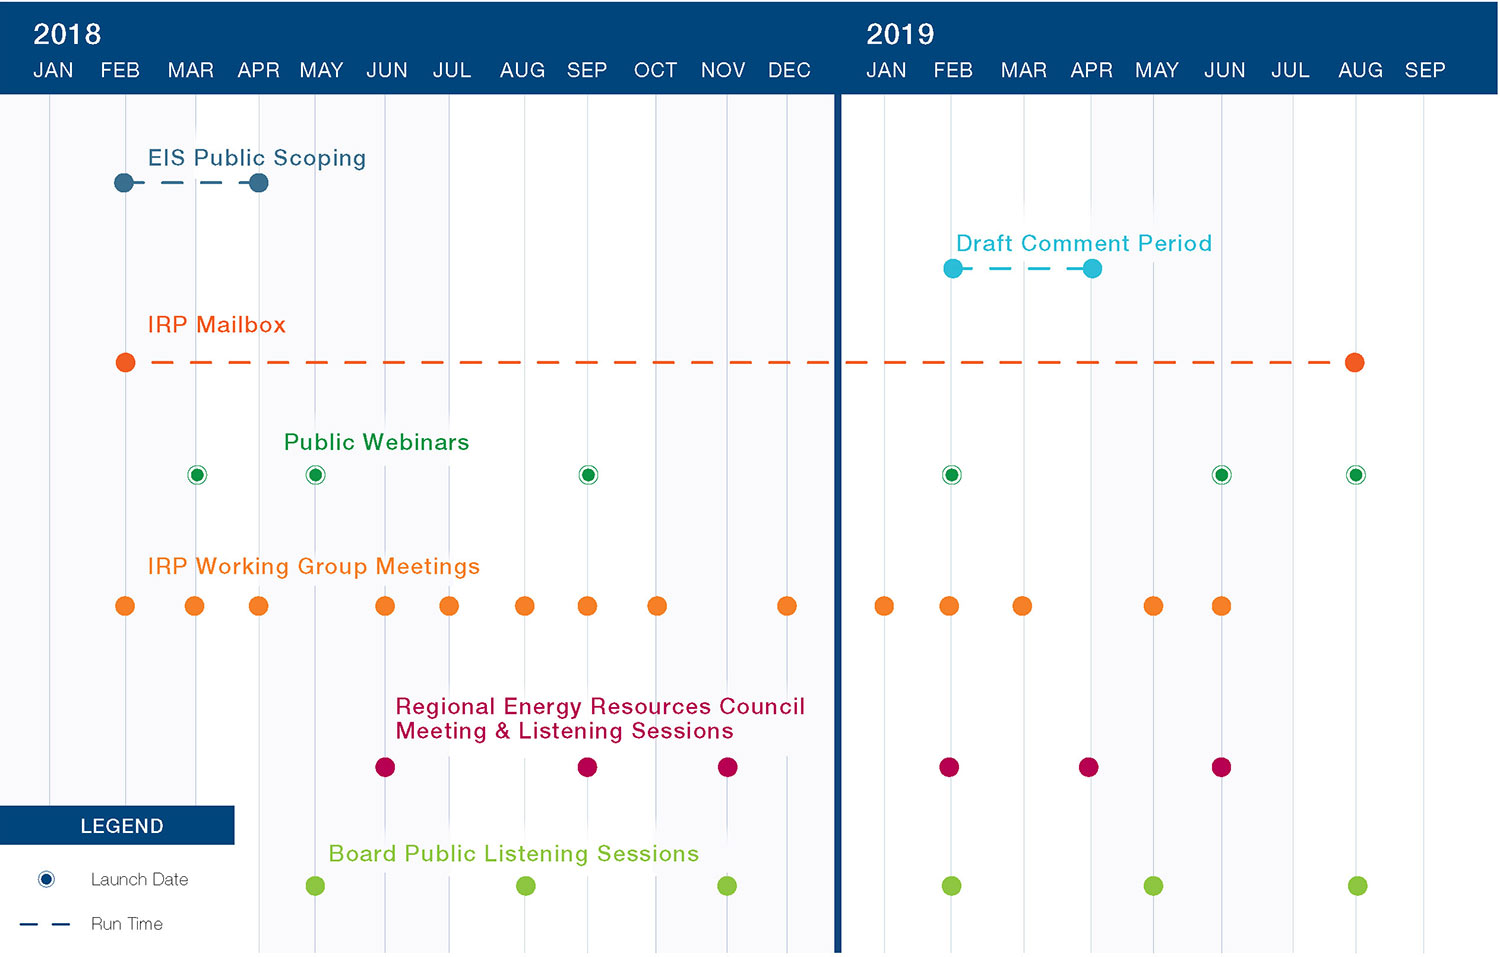
Stakeholder and Public Involvement
Thank you!
TVA received hundreds of comments during the public comment period that ended April 8. Between February 15 and April 8, 2019, the public expressed their views on the draft IRP and EIS through formal comments, or in-person at the listening session of the Regional Energy Resource Council in February and the public meetings held across the Valley in February and March. The IRP and EIS will help shape TVA’s power system over the next 20 years, and we appreciate your participation.
Public Outreach

IRP Goals & Objectives
TVA’s current power system
In FY18, TVA efficiently delivered more than 163 billion kilowatt-hours of electricity to customers.
As the nation’s largest government-owned power provider, TVA delivers safe, reliable, clean, competitively priced electricity to 154 local power companies and 58 directly served customers, large industrial customers, and federal facilities.
2018 Energy Mix
The remaining one percent results from TVA programmatic energy efficiency efforts.
What Makes an Optimal Resource Plan?
Throughout the planning process, TVA worked to ensure that the IRP met these six objectives:
LOW COST
Minimizing system cost is critical to economic efficiency and is mandated by the TVA Act.
RELIABLE
Certain assets are more reliable than others, and it was critical during the IRP process to maintain TVA’s focus on ensuring reliable power.
RISK INFORMED
TVA must manage risks such as construction costs, fuel costs or power availability, and it worked to understand and consciously accept or mitigate risks.
DIVERSE
Diversity in its power portfolio enables TVA to insulate customers from extreme market fluctuations and to use resources that are most cost-effective and reliable at that particular moment.
ENVIRONMENTALLY RESPONSIBLE
When economics were inconclusive and risks were generally balanced, an option with less environmental impact was chosen.
FLEXIBLE
A flexible power generation system ensures the capacity to incorporate renewable energy sources and distributed energy resources, along with more traditional resources, and it offers the capability to respond to a variety of future circumstances.

Developing the IRP

Planning Approach
TVA's internal experts worked with the IRP Working Group, the Regional Energy Resource Council, and other external consultants and resources throughout the modeling process.
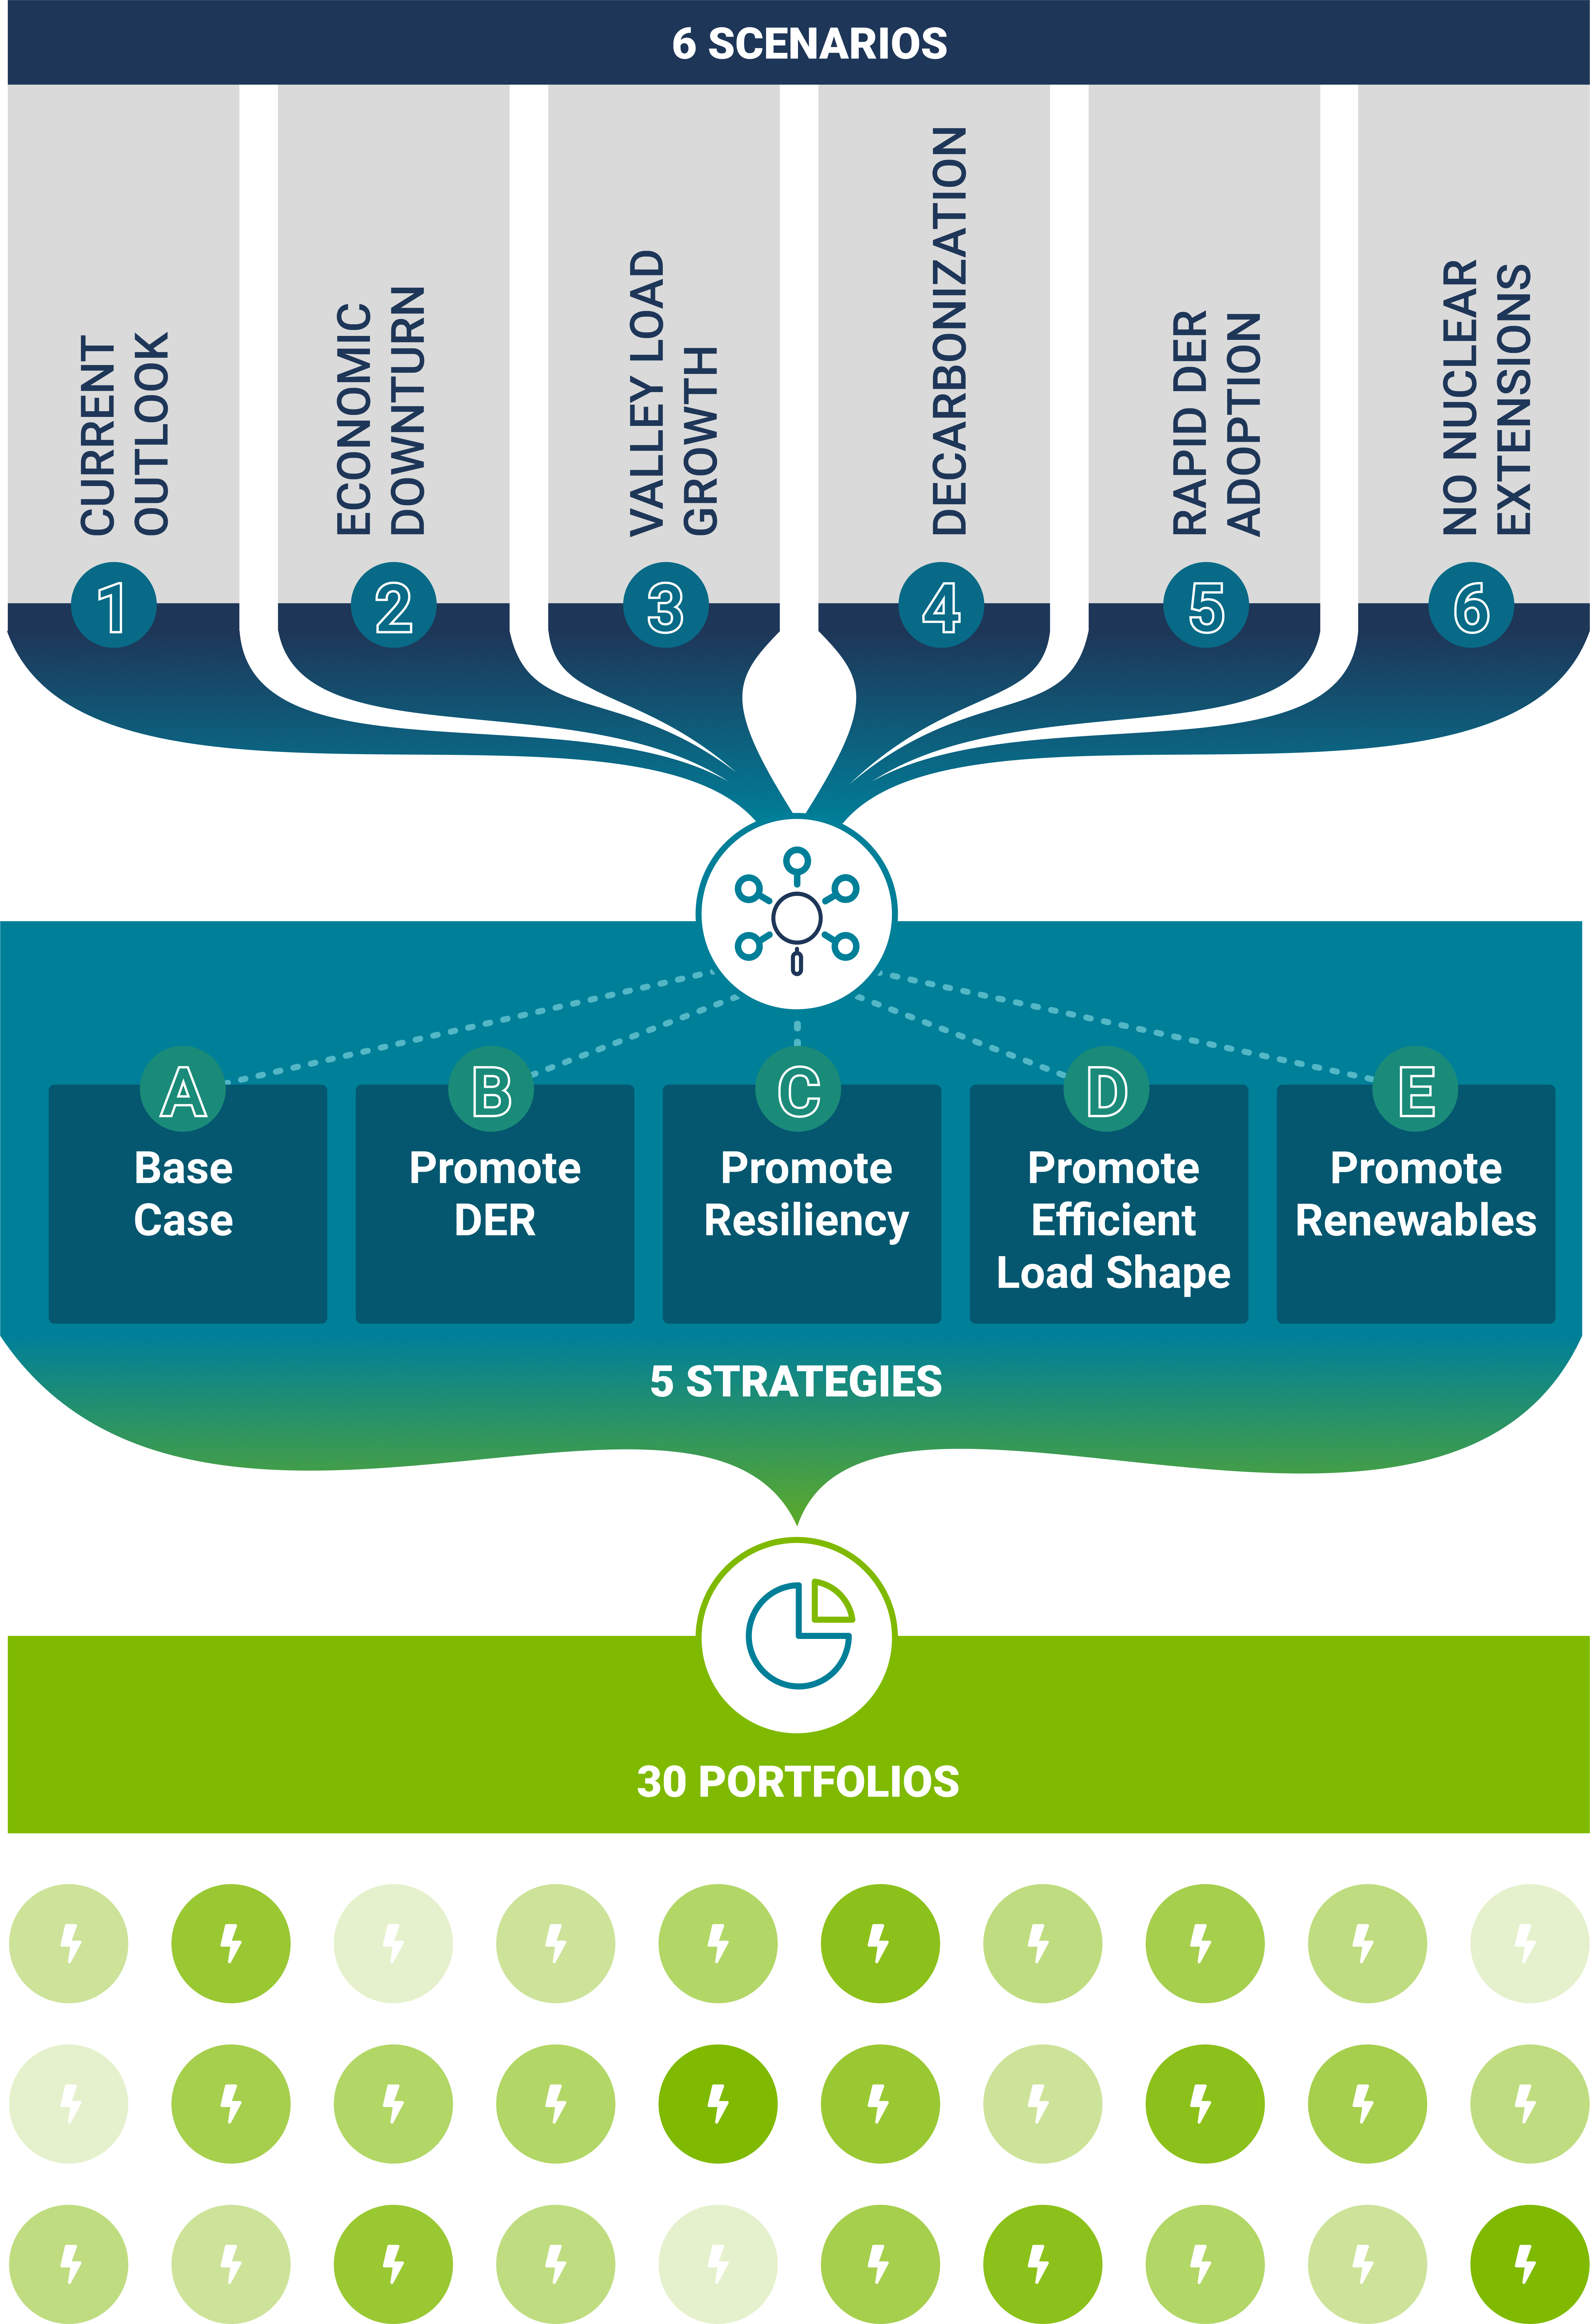
Scenarios
Strategies
Uncertainties
TVA's model also considered uncertainties that can affect the cost of electricity or mix of energy resources. The uncertainties considered in the 2019 IRP are:
- Electricity demand
- Market power price
- Natural gas prices
- CO2 regulation/price
- Coal prices
- Solar prices
- Storage prices
- Regulations
- Distributed generation penetration
- Energy efficiency adoption
- Economic outlook (national and regional)
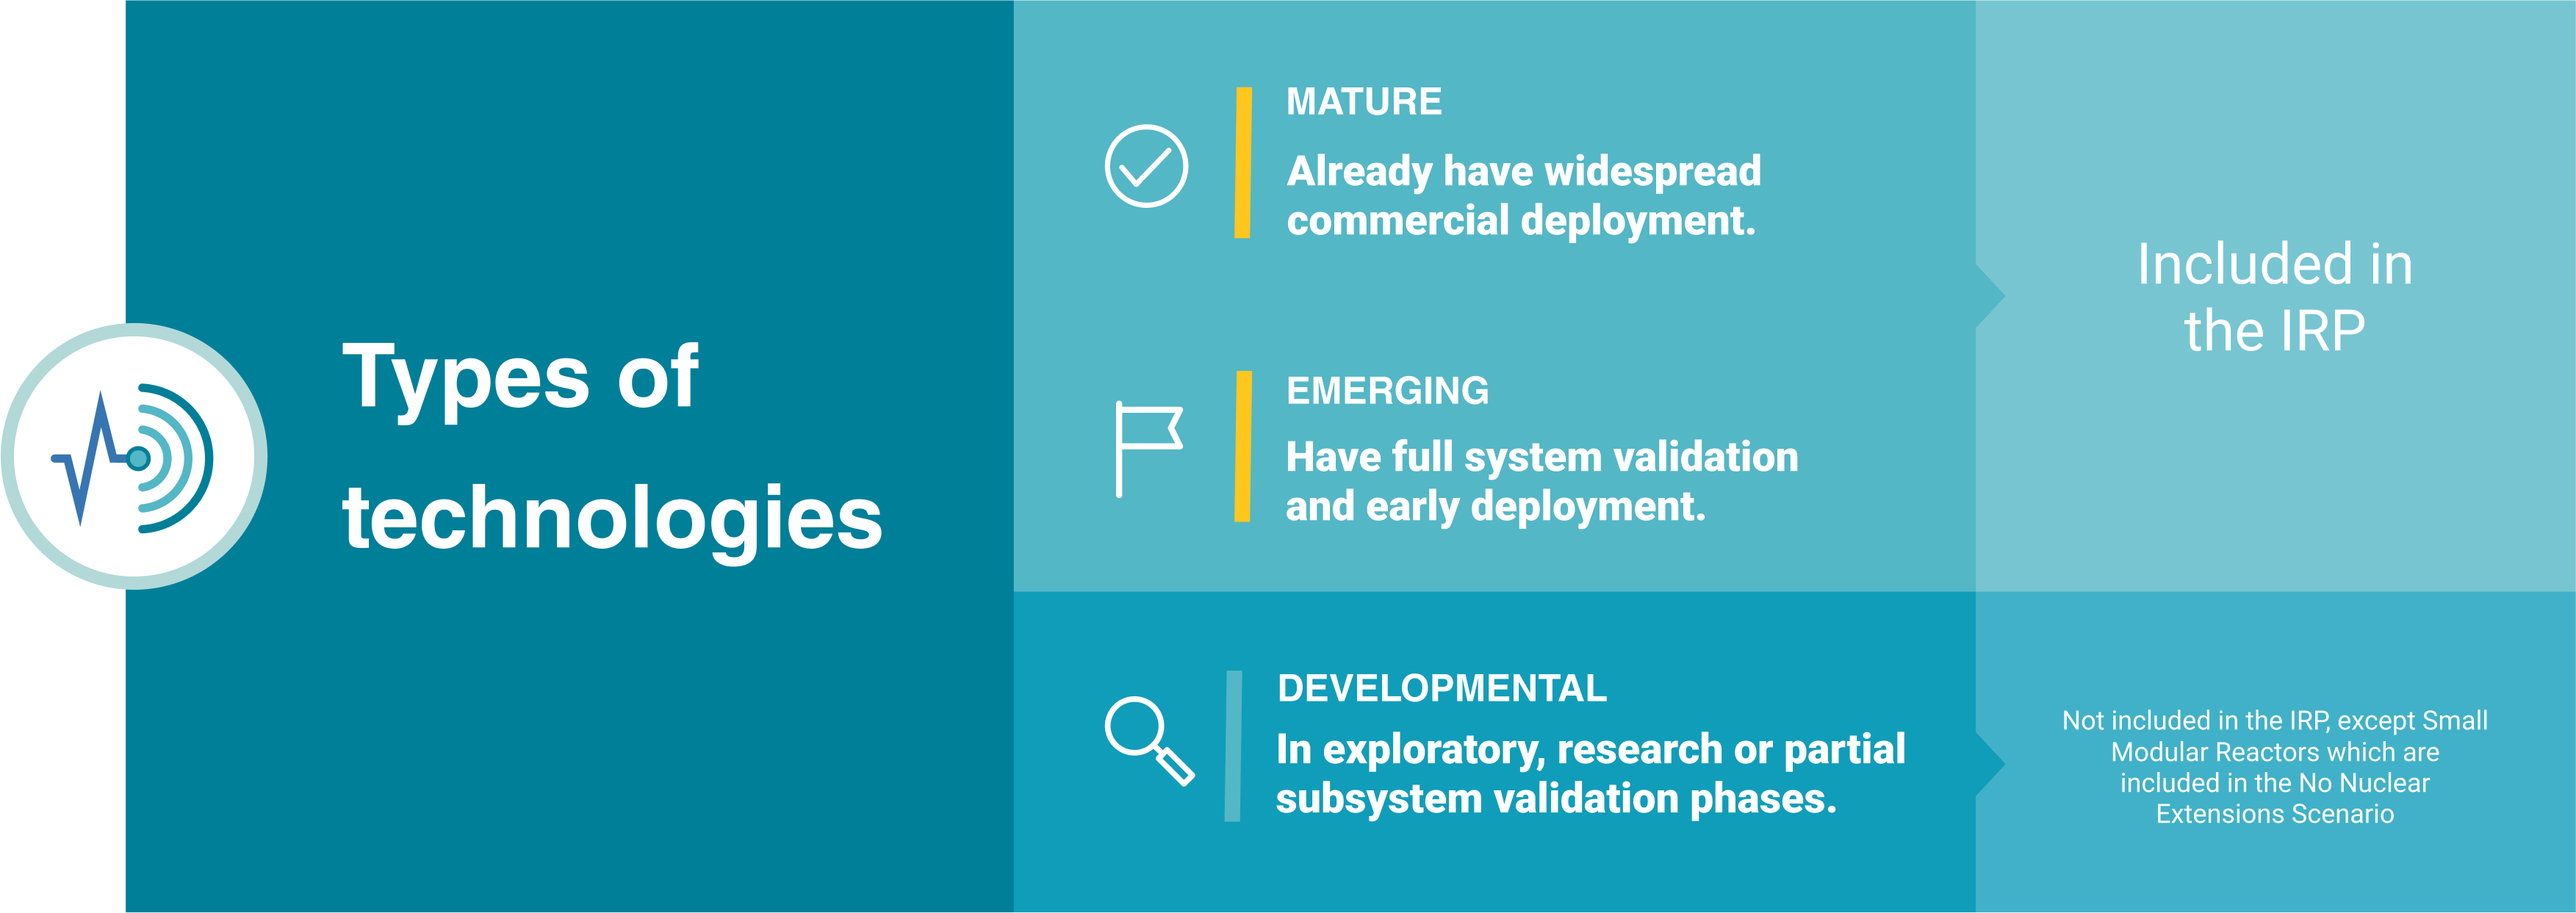
Modeling Assumptions & Candidate Technologies
Modeling assumptions, the framework of IRP planning, are the constraints and planning guidelines that are put into the model. The reliability constraint is especially critical as it ensures TVA has enough capacity at all times to provide reliable electricity to customers.
Resource Portfolios
The modeling process applied each strategy to each scenario, resulting in 30 resource portfolios. The model analyzed how to achieve the lowest-cost portfolio with each strategy in each scenario, looking for the optimal solution within that particular combination.

Evaluating the portfolios
Goal:
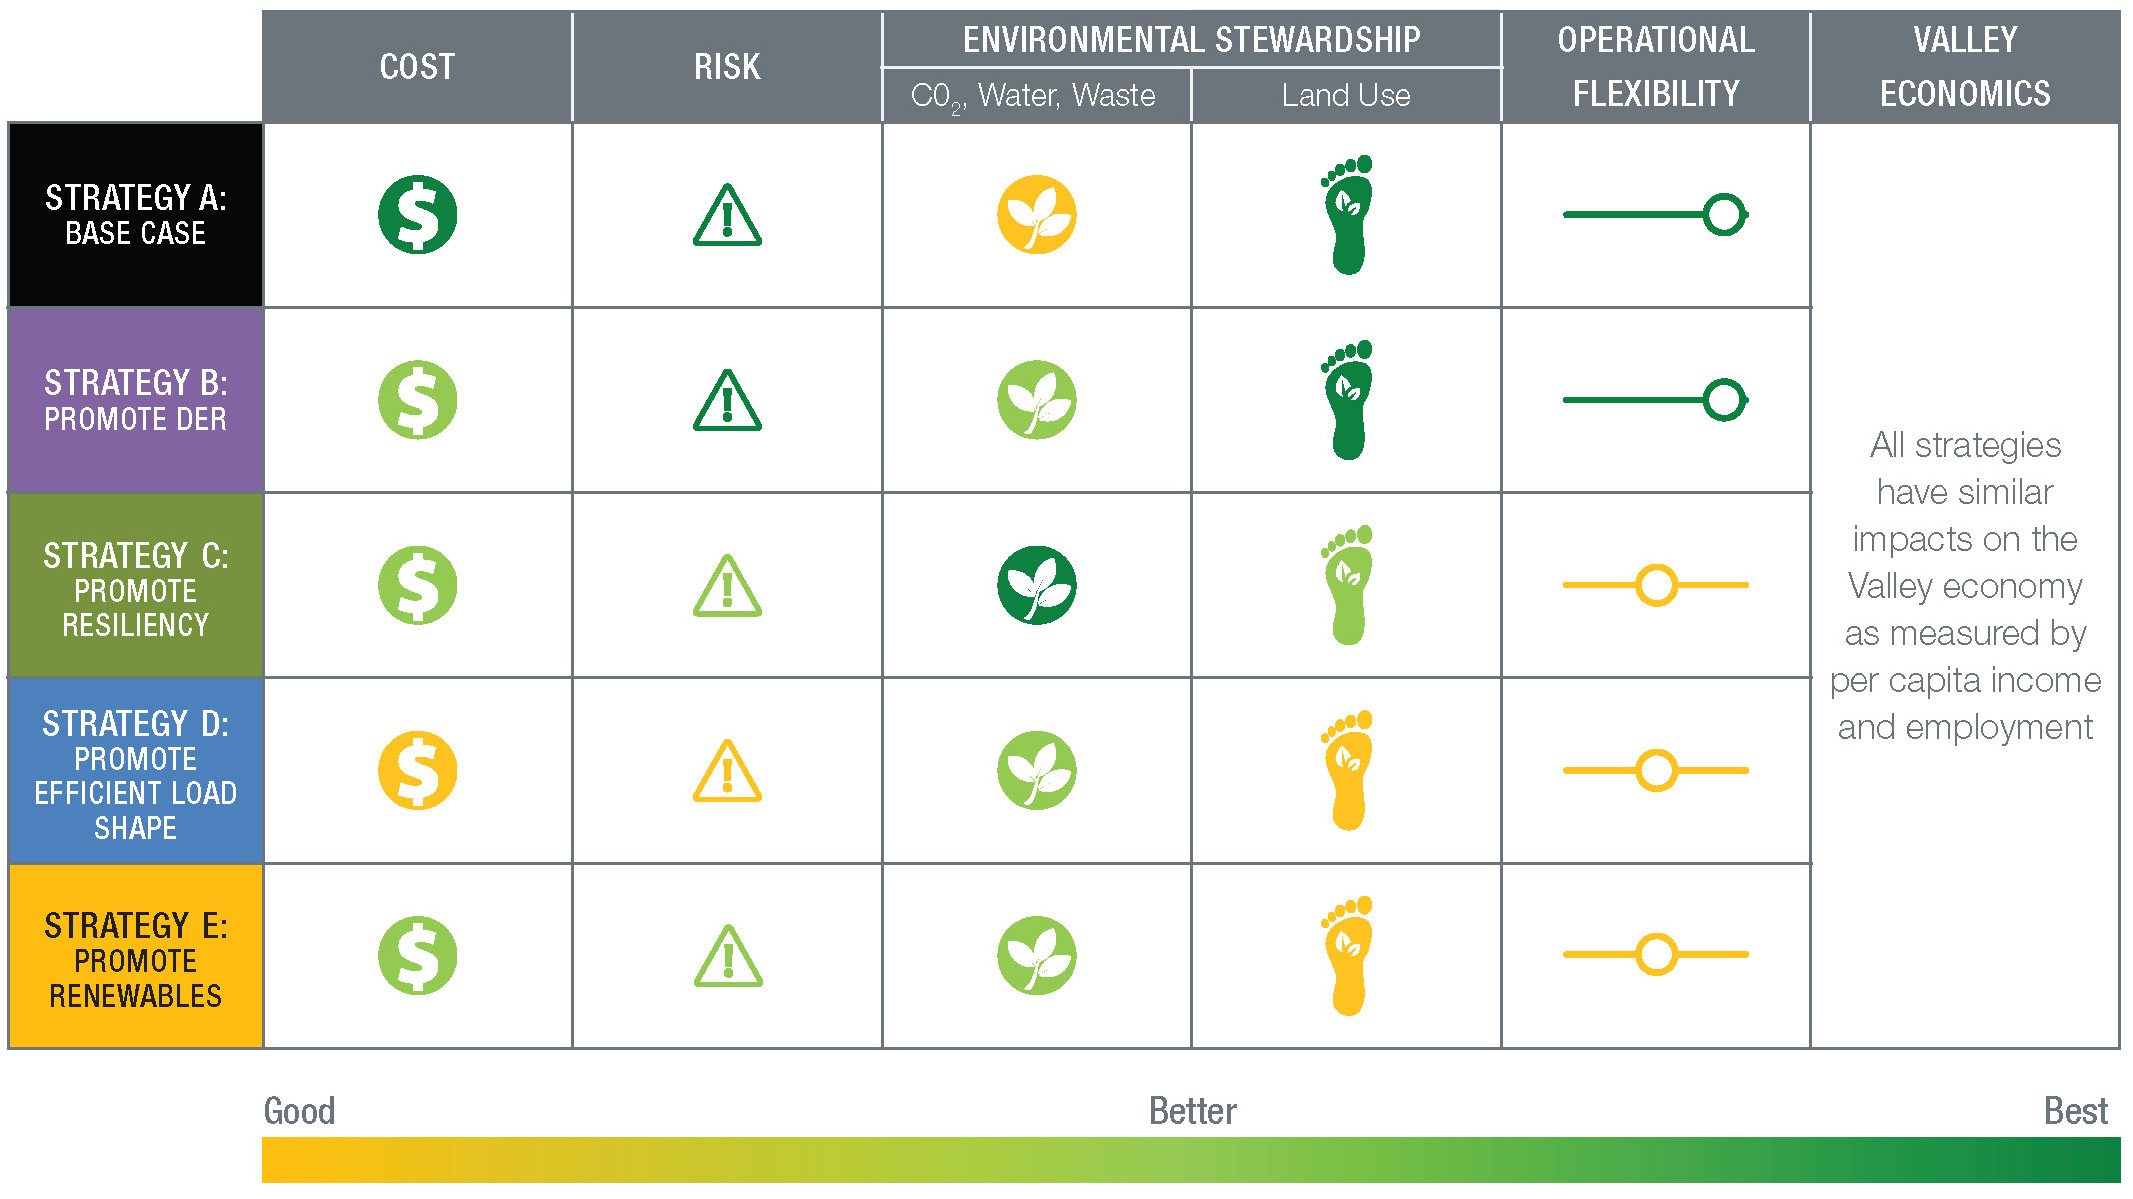
Evaluate portfolios and trade-offs with respect to TVA’s six objectives: low-cost, risk-informed, environmentally responsible, reliable, diverse and flexible.
After TVA completed the extensive modeling, the next step was to evaluate each of the 30 resource portfolios and compare them against each other. To conduct this evaluation thoroughly and methodically, TVA used metrics to compare the portfolios, and compiled the results into scorecards.
CHOOSE A STRATEGY:
Represents TVA’s current assumptions about the existing fleet and options for resource expansion.
Investing in programs that encourage use of distributed resource options such as solar or wind energy, combined heat and power, and battery storage.
Promote small, agile capacity to maximize system flexibility and promote the ability to respond to short-term power disruptions.
Encouraging efficient energy management to minimize energy intensive actions to our power system (e.g. ramping up and down for changes in demand) while continuing to support energy efficient decisions for all customers.
Meeting consumer demands for increased renewables by investing in renewable energy resources both at large scale, like a wind farm, or at small scale, like rooftop solar.
CHOOSE CAPACITY OR ENERGY:
Incremental capacity represents addition of new energy resources and retirement of existing energy resources.
Total energy represents TVA’s total power generation.
Metrics
Present Value of Revenue Requirements (PVRR) ($Bn)
Total plan cost (capital and operating) expressed as the expected (stochastic) present value of revenue requirements over the 20‐year study period
System Average Cost ($/MWh)
Expected average system cost for the study period, computed as the levelized annual average system cost (annual revenue requirements divided by annual sales)
Total Resource Cost ($Bn)
New metric for 2019 IRP
Total plan cost (capital and operating) expressed as the expected present value of revenue requirements over the study period plus participant cost net of bill savings and tax credits
Risk/Benefit Ratio
Area under the plan cost distribution curve between P(95) and expected value divided by the area between expected value and P(5) based on stochastic analysis
Risk Exposure
The point on the plan cost distribution below which the likely plan costs will fall 95% of the time based on stochastic analysis
CO2 (MMTons)
Expected annual average tons of CO2 emitted over the study period
CO2 Intensity (lbs/MWh)
Expected CO2 emissions expressed as an emission intensity, computed by dividing emissions by energy generated and purchased
Water Consumption (MMGallons)
Expected annual average gallons of water consumed over the study period
Waste (MMTons)
Expected annual average quantity of coal ash, sludge and slag projected based on energy production in each portfolio
Land Use (Acres)
New metric for 2019 IRP
Expected acreage needed for expansion units in each portfolio in 2038
Flexible Resource Coverage Ratio
New metric for 2019 IRP
The ratio of flexible capacity available to meet the maximum 3‐hour ramp in demand in 2038 to the maximum 3‐hour ramp demand in 2038
Flexibility Turn Down Factor
Ability of the system to serve low load periods as measured by percent of must‐run and non‐dispatchable generation to sales
Percent Difference in Real Per Capita Income
The change in real per capita personal income expressed as a change from a reference portfolio in each scenario
Percent Difference in Employment
The change in non-farm employment expressed as a change from a reference portfolio in each scenario
Strategy Performance
Sensitivity Analysis
When analyzing results from the draft IRP, TVA identified issues that warranted further evaluation prior to finalizing the study. In addition, TVA received helpful input from the IRP Working Group and the RERC, as well as from the public during the comment period. Many of the questions raised by TVA, stakeholders and the public focused on certain key assumptions that could influence results. To explore the impacts of changes in key assumptions and to inform the Recommendation, TVA evaluated sensitivities related to the following categories: natural gas prices; storage, wind, combined heat and power (CHP) and small modular reactor (SMR) capital costs; greater energy efficiency (EE) and demand response (DR) market depth; integration cost and flexibility benefit; pace and magnitude of solar additions; higher operating costs for coal plants; more stringent carbon constraints; and variation in climate.
Summary of 2019 IRP Sensitivities
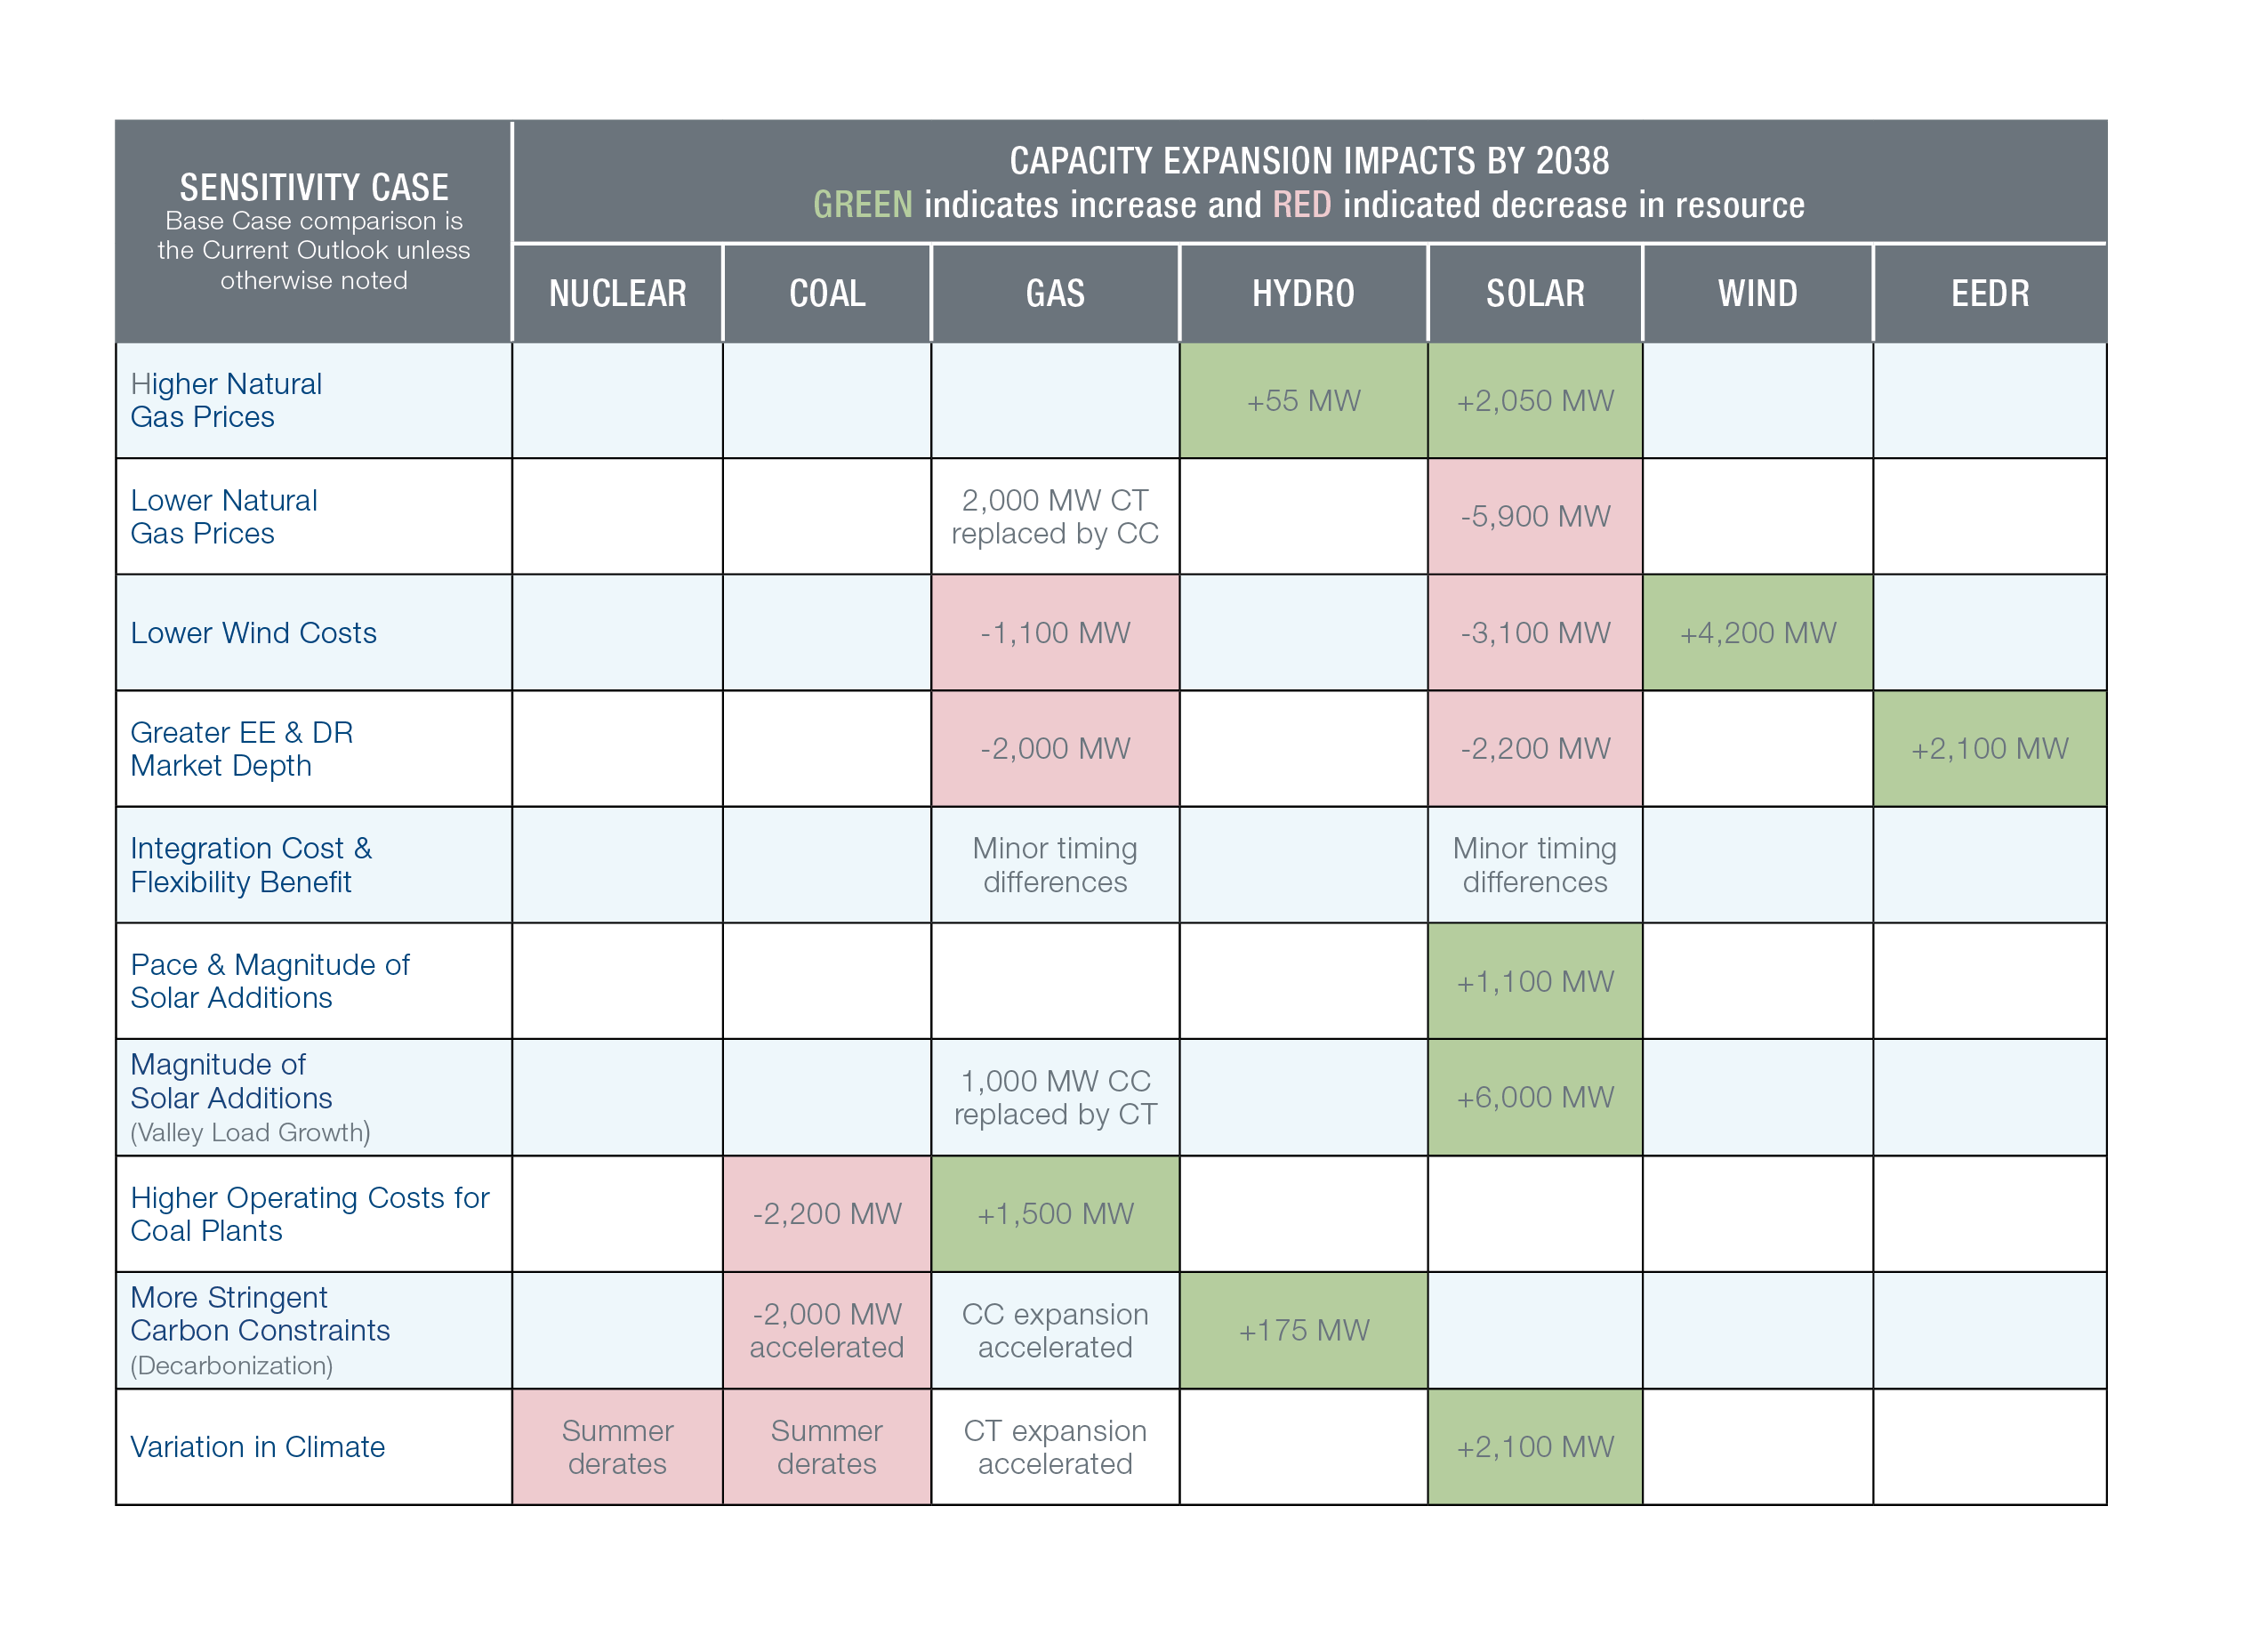
Note: Impacts shown in Summer Net Dependable MW, except for solar and wind that are shown in nameplate MW
Forming the IRP Recommendation
The IRP results — including the 30 primary cases and the sensitivity cases — provide a robust set of potential resource additions and retirements. The final Recommendation is derived from this evaluation. The Recommendation takes into account customer priorities around power cost and reliability across different futures, along with environmental stewardship and Valley economics considerations. In developing a recommendation from the study, TVA elected to establish guideline ranges for key resource types (owned or contracted) that make up the target power supply mix.
In order to distill the considerable number of cases evaluated through the original scenario and strategy analysis and the sensitivity cases, the Recommendation uses ranges that are centered on results obtained under the Current Outlook scenario. The other scenario and sensitivity results provide a sense of how the target power supply mix might change as the future changes. Recognizing that a variety of future scenarios are possible and each strategy has positive aspects, all IRP results are included in the Recommendation to provide flexibility for how the future evolves. Implementing the least-cost resource plan with all of these priorities in mind will help ensure TVA continues to fulfill its mission to serve the people of the Tennessee Valley.

The IRP and the Tennessee Valley Environment
We are committed to clean air and a clean water supply for our region, as well as protecting its historical, cultural and environmental resources.
TVA’s final Environmental Impact Statement (EIS) assesses the natural, cultural and socioeconomic impacts associated with the implementation of the 2019 IRP. Click on the icons below to learn more about each environmental resource.
CLIMATE & GREENHOUSE GAS EMISSIONS
Since 1995, carbon dioxide (CO2) emissions from power generation provided by TVA have decreased by 51 percent. All strategies and the 2019 Recommendation will result in continued, significant, long-term reductions in CO2 emissions from the generation of power. The reduction in CO2 emissions will have small but beneficial impacts on the potential for associated climate change.
LAND RESOURCES
TVA’s existing power plants, excluding the hydroelectric plants and reservoirs, occupy about 25,000 acres. For all combinations of strategies and scenarios, as well as the 2019 Recommendation, about 97 percent of the land required for new generating and storage facilities is for utility-scale, single-axis tracking solar facilities. Relative to other types of generation, solar PV facilities have a high land requirement in relation to their generating capacity. Smaller land areas would be occupied by new natural gas-fired and storage facilities.
AIR QUALITY
Air quality in the TVA region has greatly improved in recent decades and most of the region meets national air quality standards. All strategies and the 2019 Recommendation will result in significant long-term reductions in emissions of sulfur dioxide (SO2), nitrogen oxides (NOX), and mercury. A large portion of these reductions result from the full or partial retirement of coal plants.
WASTE
In 2017, the TVA coal plants produced about 1.3 million tons of ash and slag and about 1.2 million tons of scrubber waste. The production of coal combustion residuals (CCRs) has decreased in recent years with the retirement of coal units. All strategies and the 2019 Recommendation will result in long-term reductions in the production of CCRs due to the retirement of coal plants/units.
WATER RESOURCES
Power generation affects water resources by discharging treated wastewaters, by using water directly to generate electricity in hydroelectric plants, and by using water to produce steam and cool generating plants. The volume of water used by thermal generating facilities (i.e., nuclear, coal, and combined cycle facilities) decreases under all strategies and the 2019 Recommendation, resulting in beneficial effects. The potential retirement of generating facilities would result in local benefits to nearby rivers and waterways.
SOCIOECONOMICS & ENVIRONMENTAL JUSTICE
The TVA service area has a population of about 10 million, an increase of 4.5 percent since 2010. All strategies and the 2019 Recommendation have similar minimal impacts on the Valley economy as measured by per capita income and employment. The potential retirement of generating facilities could result in direct and indirect adverse socioeconomic impacts.

IRP and Other Resources
IRP Documents
Executive Summary PDF | 1 MB Executive Summary
 Frequently Asked Questions
Public Meeting Materials
 Factsheet (English)
 Meeting Presentation
 Display Boards
 Draft IRP Webinar
Contacts
For more information about the 2019 IRP study, contact:
Hunter Hydas
Enterprise Planning
1101 Market Street
Chattanooga, TN 37402
(423) 751-2453
Amy Henry
Enterprise Relations + Innovation
400 West Summit Hill Dr., WT 9D
Knoxville, TN 37902
(865) 632-4045
Matthew Higdon
NEPA Project Manager
400 West Summit Hill Dr., WT 9D
Knoxville, TN 37902
(865) 632-5051